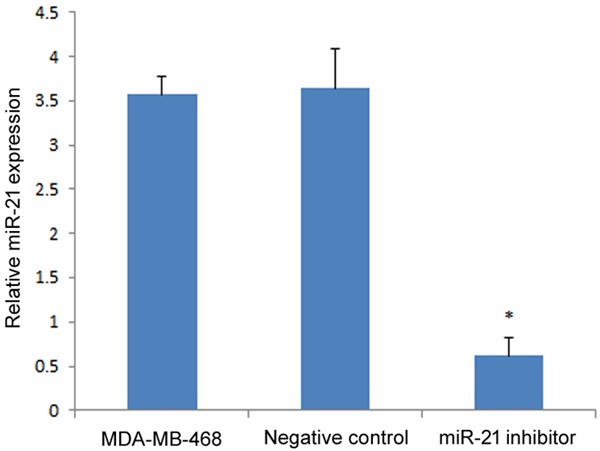
Figure 2.

miR-21 expression in MDA-MB-468 cells after transfection with the miR-21 inhibitor. The relative expression of both groups were compared to the negative control group. The asterisk* represents a significant difference between the miR-21 inhibitor transfected group and negative control (P<0.05), and the error bars indicate the standard deviation.
