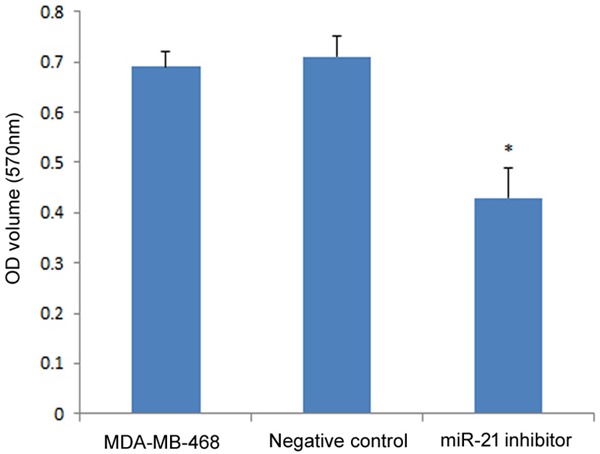
Figure 3.

Effect of miR-21 on MDA-MB-468 cell viability measured by MTT assay. The OD values of both groups were compared to the negative control. The asterisk *represents a significant difference between the miR-21 inhibitor transfected group and normal tissue (P<0.05), and the error bars indicate standard deviation.
