
Figure 1.
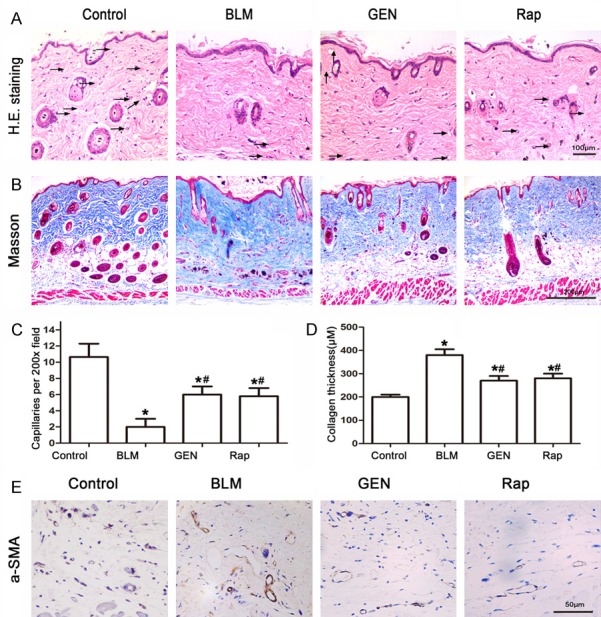
Image analysis of BLM- and geniposide-treated murine skin tissues. C57BL/6 mice received PBS, BLM, BLM and geniposide, or BLM and rapamycin treatments for 4 weeks; skin tissues were then harvested for analysis. A. H&E stain results for mouse skin tissue for the four treatments. Representative images. Black arrows indicate blood vessels. B. Fontana-Masson stain results for the four treatment groups. Representative images. C. Computerized histogram analysis of capillaries, *P<0.05, compared with control group; #P<0.05, compared with BLM group. D. A histogram of the values for collagen thickness, *P<0.05, compared with control group; #P<0.05, compared with BLM group. E. Immunohistochemistry analysis of the mesenchymal marker α-SMA, scale= 50 μm.