
Figure 4.
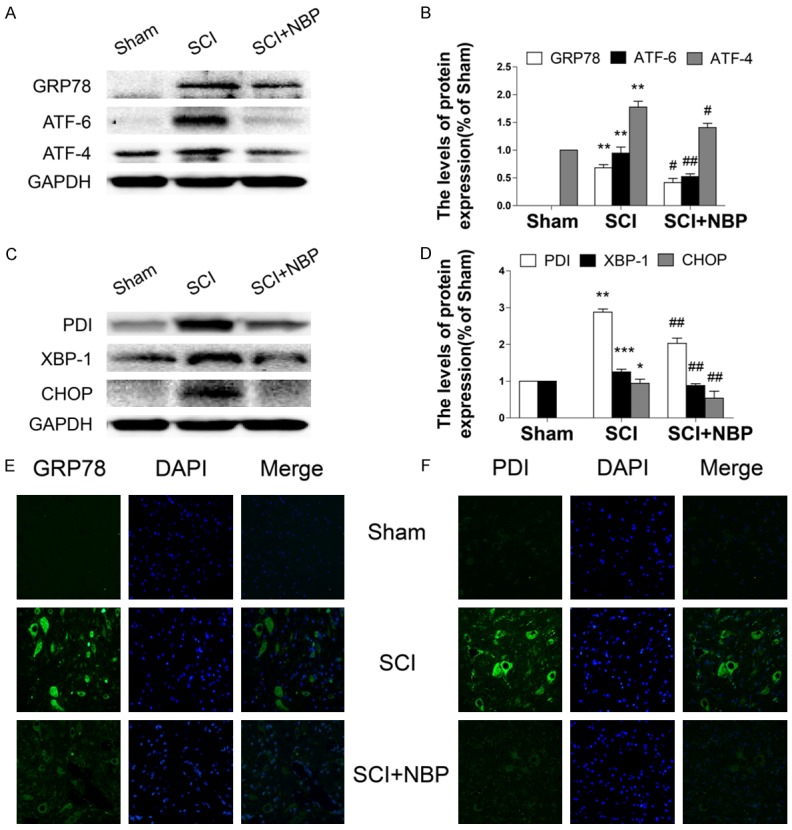
NBP inhibits activation of ER stress after SCI. A-D. Protein expression and quantification analysis of GRP78, ATF-6, ATF-4, PDI, XBP-1, and CHOP in segments of injured spinal cord in the sham, SCI, and SCI+NBP groups at 7 d after SCI. Data represent Mean values ± SEM, *P < 0.05, **P < 0.01, ***P < 0.001 versus the sham group, and #P < 0.05, ##P < 0.01 versus the SCI group, n = 5 per group. E, F. Immunofluorescence staining for cleaved caspase-3 in sections from the ventral horn of the spinal cord in the different groups at 7 d after SCI (magnification ×400).