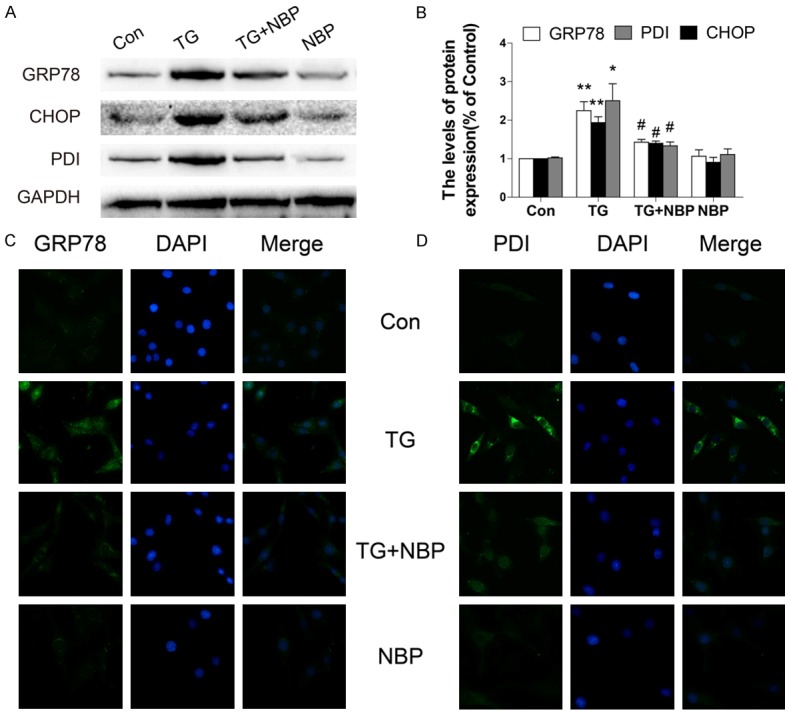
Figure 5.

NBP inhibits TG-induced ER stress in PC12 cells. A, B. Protein expression and quantification analysis of GRP78, CHOP, and PDI in PC12 cells subjected to ER stress and treated with NBP. Data represent Mean values ± SEM, *P < 0.05, **P < 0.01 versus the control group, and #P < 0.05 versus the TG group, n = 3 per group. C, D. Immunofluorescence staining for GRP78 and PDI in PC12 cells subjected to ER stress and treated with NBP (magnification ×400).
