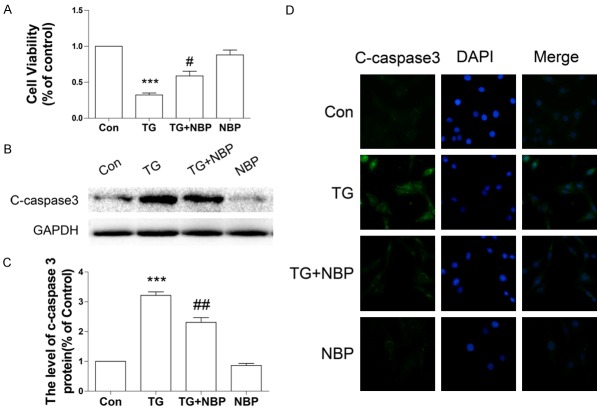
Figure 6.
NBP attenuated TG-induced apoptosis in PC12 cells. A. MTT assay results for NBP-treated PC12 cells subjected to TG stimulation. Data represent Mean values ± SEM, ***P < 0.001 versus the control group, and #P < 0.05 versus the TG group, n = 3 per group. B, C. Protein expression and quantification analysis of cleaved caspase 3 in NBP-treated PC12 cells subjected to TG stimulation. Data represent Mean values ± SEM, ***P < 0.001 versus the control group, and ##P < 0.01 versus the TG group, n = 3 per group. D. Immunofluorescence staining for cleaved caspase-3 in NBP-treated PC12 cells subjected to TG treatment (magnification ×400).

