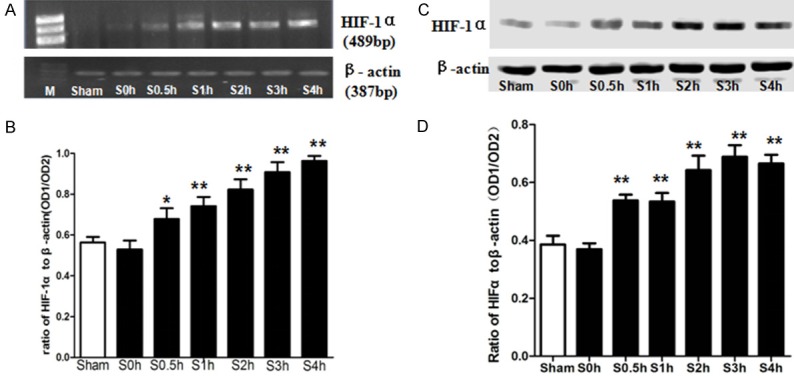
Figure 2.

The expression of HIF-1α after hemorrhagic shock. A: Electrophoresis of HIF-1α mRNA and β-actin mRNA. B: Statistical graph of graph A. C: Western blot of HIF-1α after shock. D: Statistical graph of graph C. M, molecular marker; Sham, sham-operated group; S, shocked groups. *P<0.05, **P<0.01 as compared with the sham-operated group.
