
Figure 1.
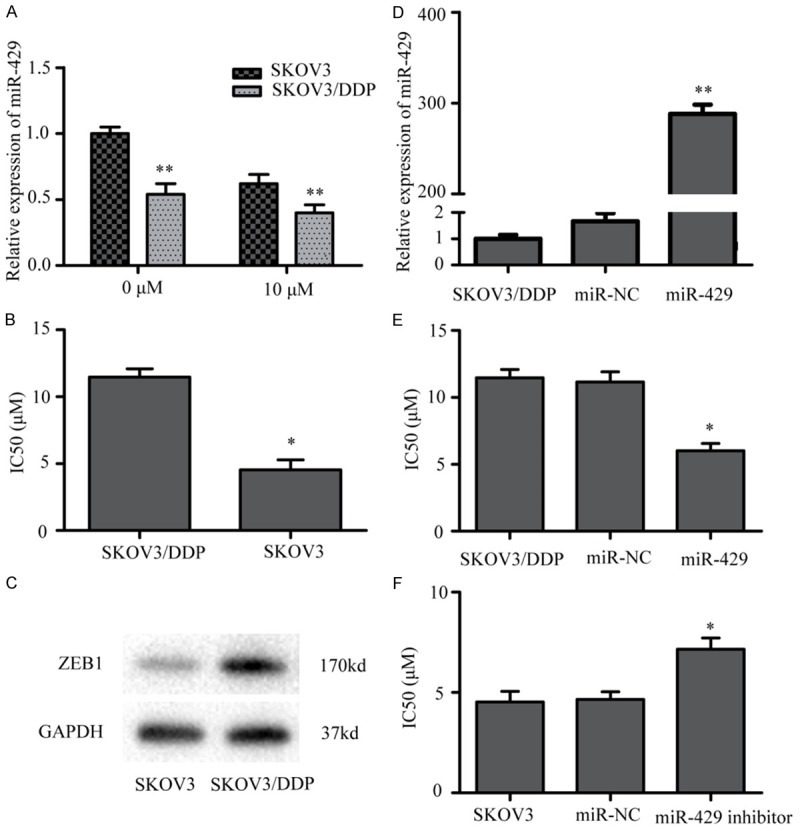
The expression of miR-429 in ovarian cancer cell lines. A. MiR-429 expression was measured by QRT-PCR in parental SKOV3 cells compared with that in cisplatin-resistant SKOV3/DDP cells. B. SKOV3/DDP and SKOV3 cells were treated with various concentrations of cisplatin for 48 h, and the 50% inhibitory concentration (IC50) of cisplatin was measured by the CCK8 assay. C. ZEB1 expression was up-regulated in SKOV3/DDP cells compared with in the parental A2780 cells. D. Displayed that the expressions of miR-429 were significantly increased in SKOV3/DDP cells infected by LV3-miR-429 compared to the blank groups. E. SKOV3/DDP cells were transfected with LV3-miR-429 or LV3-miR-NC and were exposed to a range of cisplatin concentrations. The IC50 of cisplatin was shown. F. SKOV3 cells were transient transfected with miR-429 inhibitor or miR-NC and were exposed to a range of cisplatin concentrations. The IC50 of cisplatin was shown (*P < 0.05,**P < 0.01).