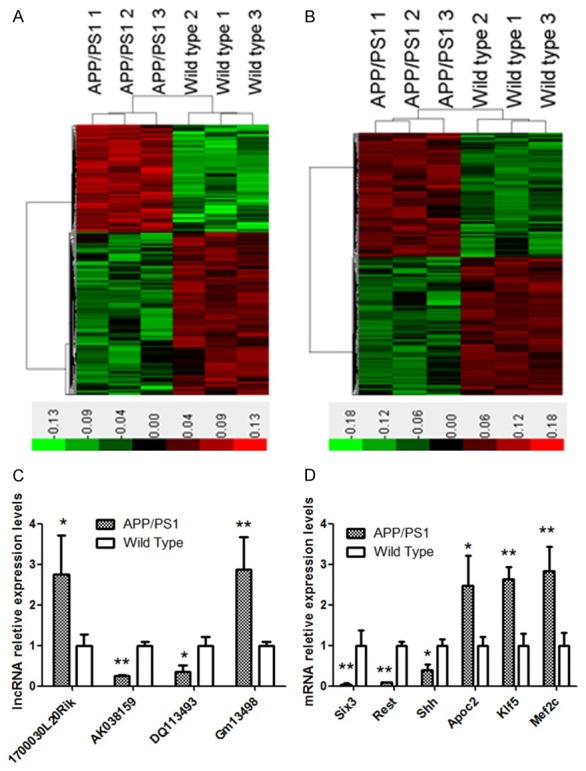
Figure 2.

LncRNA and mRNA expression profiles of the hippocampus of APP/PS1 transgenic mice. A: Hotmap analysis of differentially expressed lncRNAs; B: Hotmap analysis of differentially expressed mRNA; C: Real time PCR for lncRNAs; D: Real time PCR for mRNA. Data are shown as mean ± SD, *P<0.05 vs. wild type group, **P<0.01 vs. wild type group, Student’s t-test.
