
Figure 3.
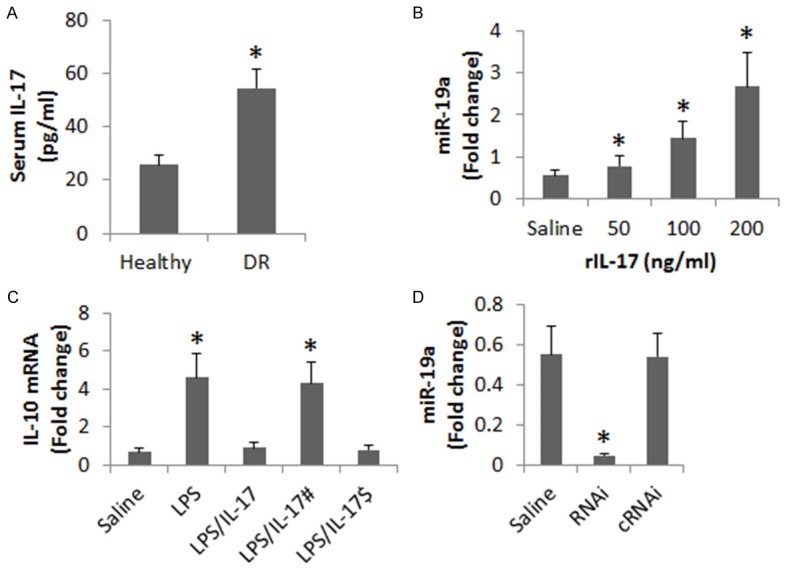
IL-17 up regulates miR-19a to suppress IL-10 expression in B cells. A. The bars indicate serum IL-17 levels of DR patients (n = 20) and healthy subjects (n = 20). B. The bars indicate the miR-19a levels in B cells after exposure to rIL-17 in the culture for 24 h (the concentrations of rIL-17 are denoted on the X axis). C. The bars indicate the IL-10 mRNA levels in the B cells after treatment with the conditions on the X axis in the culture for 24 h. LPS = 1 µg/ml. IL-17 = 200 ng/ml. #, miR-19a-deficient B cells. $, B cells were treated with controls shRNA. D. The bars indicate the miR-19a levels in B cells after treating with the conditions denoted on the X axis. Saline: B cells were treated with saline. RNAi: B cells were treated with miR-19a shRNA. cRNAi: B cells were treated with control shRNA. Data in B and C were summarized from 3 independent experiments.