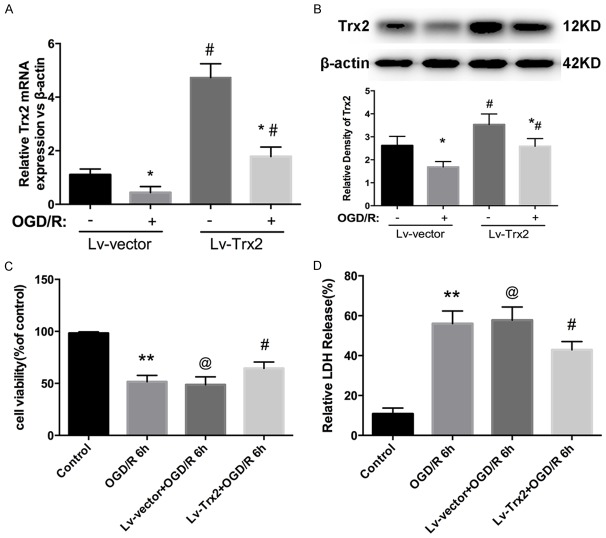
Figure 2.
Effects of Trx2 overexpression in Lv-Trx2 H9c2 cells with OGD/R model. A. Quantitative real-time PCR (qRT-PCR) analysis of Trx2 mRNA expression. B. Western blot result showing Trx2 expression. A, B. *P < 0.05 vs corresponding normoxia group, #P < 0.05 vs corresponding Lv-vector group. C. The cell viability measured by CCK-8 assay. D. Cell injury evaluated by LDH kit. C, D. **P < 0.01 vs control group, @P > 0.05 vs OGD/R group, #P < 0.05 vs Lv-vector group.

