Abstract
Urea transporter B (UT-B) is a membrane channel protein that specifically transports urea. UT-B null mouse exhibited urea selective urine concentrating ability deficiency, which suggests the potential clinical applications of the UT-B inhibitors as novel diuretics. Primary high-throughput virtual screening (HTVS) of 50000 small-molecular drug-like compounds identified 2319 hit compounds. These 2319 compounds were screened by high-throughput screening using an erythrocyte osmotic lysis assay. Based on the pharmacological data, putative UT-B binding sites were identified by structure-based drug design and validated by ligand-based and QSAR model. Additionally, UT-B structural and functional characteristics under inhibitors treated and untreated conditions were simulated by molecular dynamics (MD). As the result, we identified four classes of compounds with UT-B inhibitory activity and predicted a human UT-B model, based on which computative binding sites were identified and validated. A novel potential mechanism of UT-B inhibitory activity was discovered by comparing UT-B from different species. Results suggest residue PHE198 in rat and mouse UT-B might block the inhibitor migration pathway. Inhibitory mechanisms of UT-B inhibitors and the functions of key residues in UT-B were proposed. The binding site analysis provides a structural basis for lead identification and optimization of UT-B inhibitors.
Urea transporter B (UT-B) is a membrane protein extensively expressed in various tissues, such as kidney, testis, brain, bone marrow, spleen and erythrocyte1,2,3. Its physiological function has been well studied in kidney4,5,6.UT-B is expressed in endothelia of kidney descending vasa recta (DVR) and mediates the passive transport of urea down its concentration gradient, indispensably in renal urea recycling and urine concentration7,8. UT-B null mice exhibited urine output approximately 50% higher, and urine osmolality approximately 1/3 lower than in wild-type mice9,10, which implies that UT-B plays an important role in urinary concentrating ability and suggests the clinical applications of UT-B inhibitors as potential novel diuretics11,12,13,14,15,16,17,18. Recently, determination of the Bos taurus (Bovine) UT-B X-ray crystal structure provided a foundation for UT-B binding site identification and inhibitor discovery19,20.
To exploit novel compounds with UT-B inhibitory activity and to obtain promising lead compounds, we integrated cell based high throughput screening and in silico methods to identify a new potential UT-B inhibitor binding site and proposed the mechanism of UT-B inhibitor in different species. A small-molecule drug-like compound library of 50000 compounds was screened by high-throughput virtual screening (HTVS), which produced 2319 primary hit compounds for UT-B inhibitor. Then we employed a medium-throughput screening using an erythrocyte osmotic lysis assay and identified 4 compounds, PU21, PU168, PU468 and PU474, with UT-B inhibitory activity in vitro from the 2319 hits. 16 compounds with UT-B inhibitory activity were screened by erythrocyte osmotic lysis assay from 60 analogues of PU21 [REN et al., under review]21. PU14, one of the 16 compounds, exhibited potential inhibition activity in human, rabbit, rat, mouse in vitro and pharmacological diuresis activity in vivo21. Based on the physiological data, we built a computational mode of human UT-B by homology modeling. The putative UT-B binding sites were identified by structure-based drug design and validated by ligand-based and QSAR model. Additionally, UT-B structural and functional characteristics under inhibitors treated and untreated conditions were simulated by molecular dynamics (MD) simulation. The UT-B inhibitor binding site analysis and validation provide a structural basis for lead identification and optimization.
Results
UT-B inhibitors identified by HTVS
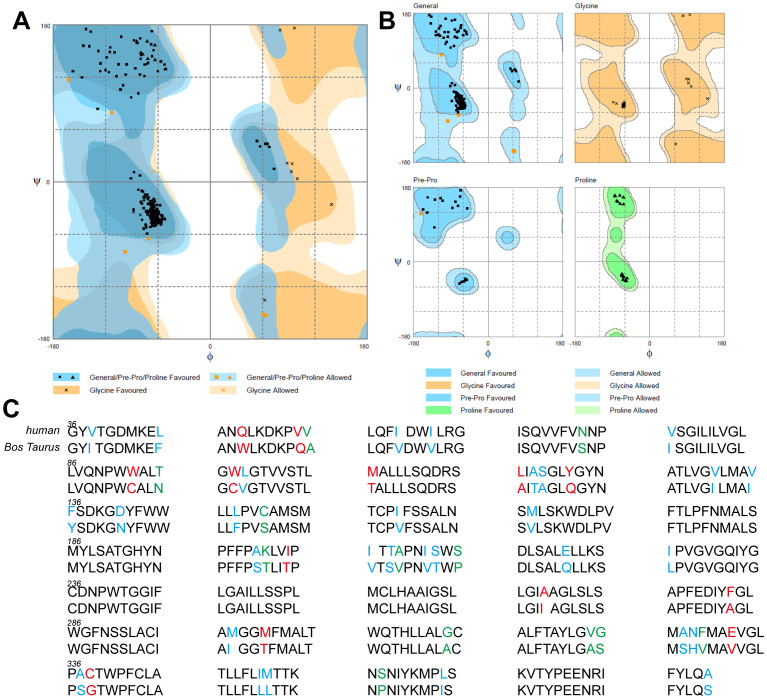
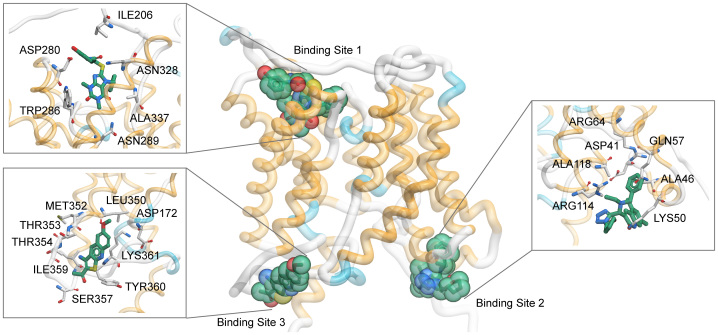
Sequence alignment was used to assess the suitability for homology modeling. The results of multiple sequence alignment show an 83.8% sequence identity and 92.8% sequence similarity between bovine and human UT-B. The Ramachandran plot shows that seven residues were distributed in the allowed region, including ASN73, ASN89, PHE176, THR191, GLY298, CYS338 and THR368 (Figure 1). A total of 336 residues were distributed within the region. Residues V206I, H328N, and S337A were involved in the binding site of the UT-B ligand, which suggests that species-specific differences of the UT-B binding site may influence the ligand binding affinity. One observable extracellular binding site (binding site 1) and two intracellular binding sites (binding sites 2 and 3) were predicted for HTVS (Figure 2). One cross-helix loop was located upside binding site 1 and urea binding site. Binding site 2 was bound in α-helix, β-turn and loop whereas binding site 3 was located between three α-helices. Based on the three binding sites, 2,319 compounds were identified by HTVS from 50,000 small-molecular drug-like compounds in Asinex database.
Figure 1.
(a, b) Ramachandran plot assessment validation of predicted human UT-B structure. (c) Sequence alignment results: Human sequence compared with Bos Taurus.
Figure 2. One extracellular (binding site 1) and two intracellular (binding site 2 and 3) hypothetic binding sites are predicted.
Key residues that are predicted to interact with UT-B inhibitors are shown. Pocket residues are shown in white while the distance between residue and ligand was set to 2.5Å. Cross-species and mutation studies suggest binding site 1 might be a possible pocket for UT-B inhibitor binding (see below).
Identification of small-molecular UT-B inhibitors by screening
Four compounds, [1-(3-amino-6-methoxythieno[2,3-b]quinolin-2-yl)ethanone], [3-((R)-(benzyl(ethyl)amino)(1-(((S)-tetrahydrofuran-2-yl)methyl)-1H-tetrazol-5-yl) methyl)-5,7-dimethylquinolin-2(1H)-one], [N-(3-(4-chlorobenzyl)-2-methyl-4- oxo-3,4-dihydroquinazolin-6-yl)furan-2-carboxamide], and [2-((7-benzyl-1,3-dimethyl- 2,6-dioxo-2,3,6,7-tetrahydro-1H-purin-8-yl)thio)-N-(3-hydroxyphenyl)acetamide] (PU21, PU168, PU468, PU474) exhibiting UT-B inhibition activity were identified from 2319 candidate compounds by an erythrocyte osmotic lysis assay. As the results show, human UT-B is more sensitive to active compounds than UT-B from two other species. Inhibition activity of each compound on human, rat, and mouse are shown in Figure 3. The IC50s for each compound are summarized in Table 1.
Figure 3. Activity of inhibitors against UT-B in human, rat and mouse.
(a) Dose-dependent inhibition activity for PU21, determined by the osmotic lysis assay in human,rat and mouse erythrocytes. (b) Dose-dependent inhibition activity for PU168. (c) Dose-dependent inhibition activity for PU468. (d) Dose-dependent inhibition activity for PU474. Mean ± s.e.m., n = 3.
Table 1. UT-B inhibition potency of four compounds in three species.
| Structure | IC50 (μM) | |||
|---|---|---|---|---|
| Human | Rat | Mouse | ||
| PU21 | 3.78 ± 0.48 | 2.62 ± 0.12 | 4.81 ± 0.40 | |
| PU168 | 0.20 ± 0.03 | > | > | |
| PU468 | 5.63 ± 0.82 | 3.18 ± 0.24 | 4.13 ± 0.33 | |
| PU474 | 0.28 ± 0.01 | > | > | |
“>” indicates the IC50 of analogs was greater than 10 μM.
Structure-based drug design
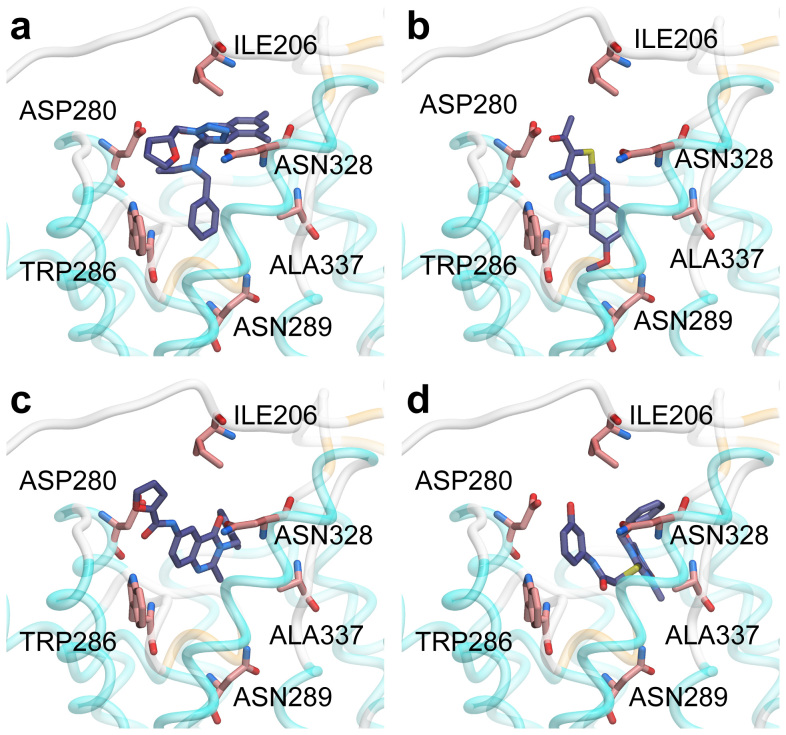
Based on the high sequence identity and similarity, we proceeded to model human UT-B structure using bovine UT-B structure. Candidate selection and ligand affinity was primarily based on Dock score, which combines the protein-ligand energy and ligand internal energy. The docking pose and Dock score of compounds PU21, PU168, PU468 and PU474 are shown in Table 2 and Figure 4. Type and occurrence of ligand-residual interaction is defined as important criterion for evaluating the function of residues. PU168 forms π–π interactions with TRP286 and hydrogen bonds with ALA337 which are anchored in binding site (Figure 4a). PU21 anchors in the binding site through generating hydrogen bonds with ASN289 (Figure 4b) whereas PU468 failed to generate hydrogen bonds and π–π interactions with any residue, but generated Van der Waals forces and hydrophobic interactions with LEU285 and ALA327 (Figure 4c). PU474 forms more hydrogen bonds than the other compounds with ILE206, ASP280, ASN289 and ASN328. PU474 also generates π–π interactions with TRP286 (Figure 4d). On the other hand, residues LEU285 and ALA327 generate strong Van der Waals forces and hydrophobic interactions with PU21, PU168, PU468 and PU474.
Table 2. The docking results of UT-B inhibitors.
| Name | pIC50 | Dock Score | -PLP1 | -PLP2 | Jain | -PMF | Rotate bond | MW | Internal energy |
|---|---|---|---|---|---|---|---|---|---|
| PU-02 | 5.071 | 41.432 | 57.71 | 51.95 | 0.39 | 90.13 | 1 | 256.32 | −2.507 |
| PU-14 | 5.454 | 42.849 | 56.93 | 54.92 | 0.86 | 93.68 | 1 | 256.32 | −3.163 |
| PU-23 | 5.429 | 48.055 | 58.07 | 54.7 | 0.6 | 90.91 | 3 | 286.35 | −3.933 |
| PU-26 | 6.206 | 64.201 | 78.7 | 75.14 | 2.84 | 128.09 | 4 | 452.55 | −5.608 |
| PU-31 | 6.408 | 41.137 | 59.24 | 52.45 | 0.7 | 87.59 | 1 | 256.32 | −2.371 |
| PU-33 | 5.250 | 62.756 | 79.33 | 70.25 | 1.32 | 109.36 | 4 | 368.47 | −4.888 |
| PU-34 | 5.136 | 41.824 | 56.64 | 54.41 | 1.46 | 91.23 | 1 | 257.31 | −2.631 |
| PU-35 | 6.339 | 58.734 | 78.47 | 72.11 | 2.27 | 114.11 | 3 | 341.43 | −4.895 |
| PU-47 | 4.819 | 58.649 | 81.74 | 72.78 | 1.64 | 121.64 | 4 | 357.43 | −3.651 |
| PU-48 | 6.728 | 47.185 | 60.03 | 57.82 | 1.02 | 90.92 | 3 | 288.32 | −3.872 |
| PU-49 | 4.885 | 61.726 | 74.8 | 72.58 | 1.63 | 115.3 | 5 | 381.42 | −6.483 |
| PU-55 | 6.657 | 49.098 | 63.3 | 56.8 | 0.11 | 98.52 | 4 | 302.35 | −4.635 |
| PU-57 | 4.753 | 55.203 | 73.65 | 67.08 | 1.34 | 118.49 | 3 | 369.48 | −3.693 |
| PU-58 | 6.123 | 60.2 | 71.81 | 65.8 | 1.5 | 123.37 | 5 | 370.47 | −5.177 |
| PU-59 | 6.276 | 27.012 | 50.23 | 48.35 | −0.35 | 104.38 | 6 | 532.58 | 13.1 |
| PU21 | 6.770 | 46.437 | 71.67 | 64.9 | 2.55 | 86.75 | 2 | 272.32 | −2.516 |
| PU168 | 6.553 | 19.037 | 81.77 | 72.01 | 4.25 | 117.94 | 8 | 472.59 | 8.399 |
| PU468 | 6.167 | 50.314 | 60.47 | 49.37 | 1.63 | 116.07 | 4 | 393.83 | −1.896 |
| PU474 | 6.495 | 58.53 | 86.32 | 79.38 | 2.9 | 124.9 | 7 | 451.5 | 0.273 |
pIC50 = -log(IC50) + 6.
Figure 4. Binding pose of (a) PU168, (b) PU21, (c) PU468, (d) PU474 in the UT-B predicted binding site.
Rigid docking pose provides details of the functional group-residue interactions and insights into residue mutation. The hydroxyl group of PU21 can interact with ASN289 inside the binding pocket whereas PU168, PU468 and PU474 cannot.
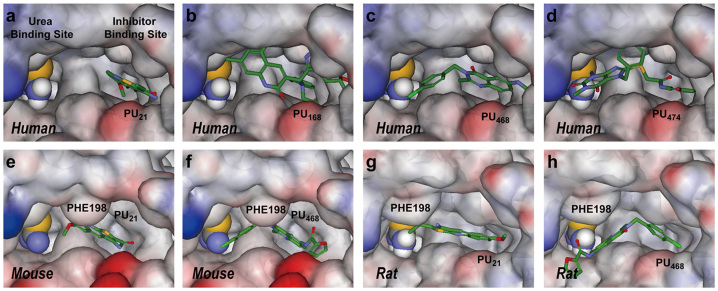
In a mutation study, PU168 docking with a W286G model showed a significant increase in binding affinity, from 19.037 to 55.154. The binding affinity of PU474 is also enhanced in the W286G model, with an increase to 5.778, suggesting TRP286 might have a weak binding affinity function. Residues of inhibitor binding site include ILE206, VAL324, ASN328 and ALA337 in human, which are different from other species. However, the binding affinity residuals of PU21, PU168, PU474 in rat and mouse UT-B show a significant increase compared with UT-B in human (Table 3). Homology models superimposed by multiple sequence alignments show that the extracellular loop of mouse and rat UT-B folded to form a different structure compared with human UT-B, with a RMSD of 0.1411 Å and 0.1114 Å, respectively (Table 4). In addition, there are high folding distances between human: rat and human: mouse of 15.8 Å and 18.1 Å, respectively. Insight from fined-grained view, residue PHE198 of rat and mouse UT-B, located in the extracellular flexible loop, generate a steric bulk that evolves into the formation of an inhibitor binding site (Figure 5). The results of the binding affinity calculation and the formation of PHE198 suggest that PHE198 might block the inhibitor migration pathway.
Table 3. Re-docking result of four compounds in three species.
| Rat | Mouse | |||
|---|---|---|---|---|
| Name | Dock Score | Residual | Dock Score | Residual |
| PU21 | 62.118 | 15.681 | 62.308 | 15.871 |
| PU168 | 43.655 | 24.618 | 53.446 | 34.409 |
| PU468 | 64.505 | 14.191 | 72.361 | 22.047 |
| PU474 | 59.897 | 1.367 | 61.178 | 2.648 |
Residual = Score(Rat or Mouse) – Score (human).
Table 4. Superimposed and root mean square deviation (Å) evaluation of UT-B in four species.
| Species | Bovine | Mouse | Rat | Human |
|---|---|---|---|---|
| Bovine | 0 | 0.1429 | 0.1227 | 0.1352 |
| Mouse | 0.1429 | 0 | 0.1176 | 0.1411 |
| Rat | 0.1227 | 0.1176 | 0 | 0.1114 |
| Human | 0.1352 | 0.1411 | 0.1114 | 0 |
Figure 5. Figure illustrates the structural differences in inhibitor binding site in UT-B between human, mouse and rat.
Re-docking poses of PU21, PU168, PU468 and PU474 in human are shown at (a–d), respectively. PU21 and PU468 re-docking poses in mouse and rat UT-B are shown at (e–f) and (g–h), respectively. The tertiary structure of the extracellular binding site demonstrates the steric hindrance difference, which is caused by PHE198 in mouse or rat UT-B. Only PU21 and PU468 can anchor in human, mouse and rat UT-B.
Ligand-based drug design
The genetic function approximation (GFA) that generated a model with a coefficient of determination (R2) of 0.8188 was used to determine the most representative descriptors: ES_Sum_ssCH2, ES_Sum_aaCH, ES_Sum_dssC, ES_Sum_aasC, ES_Count_dssC, Molecular_Solubility, Num_H_Acceptors, Molecular_PolarSurfaceArea, Molecular_PolarSASA, Energy (Table S1).
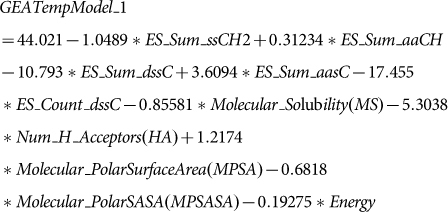 |
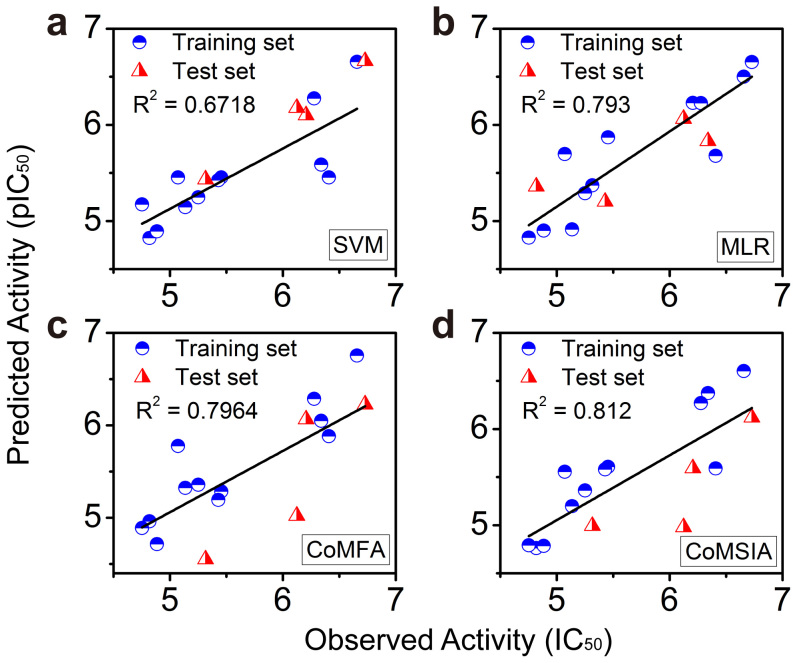
The aforementioned descriptors were then used in the generation of SVM and MLR models. The R2 of the SVM and MLR models were 0.6718 and 0.793 (Figure 6a, b), which suggests that the model of SVM is acceptable (>0.5). The model of MLR is suitable for prediction (~0.8). The non-QSAR predicted pIC50 of the UT-B inhibitors are listed in Table 5. The residuals of pIC50 of PU21, PU168, PU468 and PU474 are: 1.442, 0.274, 0.726 and 0.869, respectively. Compared with the SVM model, MLR shows more promise in calculating the prediction set. Descriptors in GFA, such as number of HA, MS, MPSA, and MPSASA, have contributed greatly to the stabilization of protein-ligand interaction. Moreover, HA has contributed strongly in defining drug-like properties in silico. The number of hydrogen bond acceptors of PU21, PU168, PU468 and PU474 are: 4, 6, 3, and 6, respectively. However, the binding affinities of PU168 and PU474 are restrained by TRP286.
Figure 6. Ligand-Based and QSAR model validation.
Coefficient correlations (R2) were used to validate the predicted model. (a) The linear model shows R2 of 0.6718 and (b) the nonlinear model shows a promising R2 of 0.793. (c–d) High coefficient correlation (In biomedical criteria, R2 > 0.5 represents a predictable model) of QSAR model suggests QSAR is more suitable in predicting UT-B inhibitor bioactivity.
Table 5. SVM, MLR and QSAR predicted model.
| SVM | MLR | CoMFA | CoMSIA | |||||||
|---|---|---|---|---|---|---|---|---|---|---|
| Index | Name | pIC50 | Predict | Residual | Predict | Residual | Predict | Residual | Predict | Residual |
| 1 | PU-02 | 5.071 | 5.454 | −0.383 | 5.697 | −0.626 | 5.777 | −0.706 | 5.556 | −0.485 |
| 2 | PU-14 | 5.454 | 5.454 | 0 | 5.870 | −0.416 | 5.286 | 0.168 | 5.606 | −0.152 |
| 3 | PU-23 | 5.429 | 5.425 | 0.004 | *5.201 | 0.228 | 5.193 | 0.236 | 5.581 | −0.152 |
| 4 | PU-26 | 6.206 | *6.100 | 0.106 | 6.228 | −0.022 | *6.025 | 0.181 | *5.592 | 0.614 |
| 5 | PU-31 | 6.408 | 5.454 | 0.954 | 5.679 | 0.729 | 5.883 | 0.525 | 5.591 | 0.817 |
| 6 | PU-33 | 5.250 | 5.246 | 0.004 | 5.289 | −0.039 | 5.357 | −0.107 | 5.362 | −0.112 |
| 7 | PU-34 | 5.136 | 5.144 | −0.008 | 4.913 | 0.223 | 5.323 | −0.187 | 5.198 | −0.062 |
| 8 | PU-35 | 6.339 | 5.587 | 0.752 | *5.831 | 0.508 | 6.049 | 0.29 | 6.374 | −0.035 |
| 9 | PU-47 | 4.819 | 4.824 | −0.005 | *5.359 | −0.54 | 4.961 | −0.142 | 4.762 | 0.057 |
| 10 | PU-48 | 6.728 | *6.664 | 0.064 | 6.654 | 0.074 | *6.226 | 0.502 | *6.12 | 0.608 |
| 11 | PU-49 | 4.885 | 4.894 | −0.009 | 4.902 | −0.017 | 4.715 | 0.17 | 4.784 | 0.101 |
| 12 | PU-55 | 6.657 | 6.656 | 0.001 | 6.501 | 0.156 | 6.755 | −0.098 | 6.602 | 0.055 |
| 13 | PU-57 | 4.753 | 5.174 | −0.421 | 4.828 | −0.075 | 4.89 | −0.137 | 4.79 | −0.037 |
| 14 | PU-58 | 6.123 | *6.177 | −0.054 | *6.063 | 0.06 | *5.022 | 1.101 | *4.98 | 1.143 |
| 15 | PU-59 | 6.276 | 6.276 | 0 | 6.227 | 0.049 | 6.287 | −0.011 | 6.27 | 0.006 |
| **16 | PU21 | 6.770 | 5.328 | 1.442 | 6.385 | 0.385 | 6.161 | 0.609 | 7.027 | −0.257 |
| **17 | PU168 | 6.553 | 6.279 | 0.274 | 6.515 | 0.038 | 6.186 | 0.367 | 6.667 | −0.114 |
| **18 | PU468 | 6.167 | 5.441 | 0.726 | 6.042 | 0.125 | 4.974 | 1.193 | 5.027 | 1.14 |
| **19 | PU474 | 6.495 | 5.626 | 0.869 | 6.639 | −0.144 | 6.238 | 0.257 | 6.759 | −0.264 |
*:Test set.
**:Prediction set.
Quantitative structure activity relationship (QSAR) was constructed by CoMFA and CoMSIA. The PLS results are listed in Table 6. The CoMFA models, in which the steric file was used as a primary parameter, were constructed with an optimal number of components (ONC) of six, and with cross validation and non-cross validation correlation coefficients q2 and r2 of 0.682 and 0.796, and with an F-test value of 32.57. For the CoMSIA model, steric, hydrophobic, and h-bond acceptor properties were coupled with a model ONC of six, with the highest r2 and q2, of 0.812 and 0.676 respectively.
Table 6. The evaluation of QSAR models which were constructed by a partial least squares (PLS) algorithm.
| Cross validation | Non-cross validation | Fraction | ||||||||||
|---|---|---|---|---|---|---|---|---|---|---|---|---|
| CoMFA* | CoMSIA | ONC | q2 | r2 | SEE | F | S | E | H | D | A | |
| ONC | 6 | S | 6 | 0.596 | 0.702 | 0.559 | 19.63 | 1.000 | - | - | - | |
| q2cv | 0.682 | H | 6 | 0.544 | 0.784 | 0.475 | 30.31 | - | - | 1.000 | - | |
| r2 | 0.796 | D | 6 | 0.454 | 0.523 | 0.707 | 9.13 | - | - | - | 1.000 | |
| SEE | 0.462 | A | 6 | 0.531 | 0.756 | 0.506 | 25.78 | - | - | - | - | 1.000 |
| F | 32.57 | SH | 6 | 0.525 | 0.807 | 0.450 | 34.85 | 0.376 | - | 0.624 | - | - |
| SD | 6 | 0.503 | 0.701 | 0.560 | 19.50 | 0.627 | - | - | 0.373 | - | ||
| SA | 6 | 0.578 | 0.785 | 0.475 | 30.41 | 0.436 | - | - | - | 0.564 | ||
| HD | 6 | 0.512 | 0.769 | 0.492 | 27.70 | - | - | 0.666 | 0.334 | - | ||
| HA | 6 | 0.562 | 0.802 | 0.455 | 33.78 | - | - | 0.547 | - | 0.453 | ||
| DA | 6 | 0.499 | 0.808 | 0.449 | 35.00 | - | - | - | 0.312 | 0.688 | ||
| SHD | 6 | 0.638 | 0.776 | 0.484 | 28.90 | 0.209 | - | 0.514 | 0.276 | - | ||
| SHA* | 6 | 0.676 | 0.812 | 0.444 | 35.99 | 0.235 | - | 0.434 | - | 0.331 | ||
| SDA | 6 | 0.623 | 0.765 | 0.496 | 27.15 | 0.324 | - | - | 0.266 | 0.410 | ||
| HDA | 6 | 0.624 | 0.773 | 0.487 | 28.43 | - | - | 0.445 | 0.252 | 0.302 | ||
| SEHD | 6 | 0.652 | 0.776 | 0.484 | 28.90 | 0.209 | 0.000 | 0.514 | 0.276 | - | ||
| SEHA | 6 | 0.673 | 0.812 | 0.444 | 35.99 | 0.235 | 0.000 | 0.434 | - | 0.331 | ||
| SEDA | 6 | 0.631 | 0.765 | 0.496 | 27.15 | 0.324 | 0.000 | - | 0.266 | 0.410 | ||
| SHDA | 6 | 0.625 | 0.777 | 0.483 | 29.05 | 0.163 | - | 0.328 | 0.231 | 0.279 | ||
| EHDA | 6 | 0.627 | 0.773 | 0.773 | 28.43 | - | 0.000 | 0.445 | 0.252 | 0.302 | ||
| SEHDA | 6 | 0.634 | 0.777 | 0.483 | 29.05 | 0.163 | 0.000 | 0.328 | 0.231 | 0.279 | ||
The above abbreviations represent:
A: Acceptor. D: Donor. E: Electrostatic. F: F-test value. H: Hydrophobic. ONC: Optimal number of components. PLS: partial least squares. S: Steric. SEE: Standard error of estimate. *: Optimum prediction model.
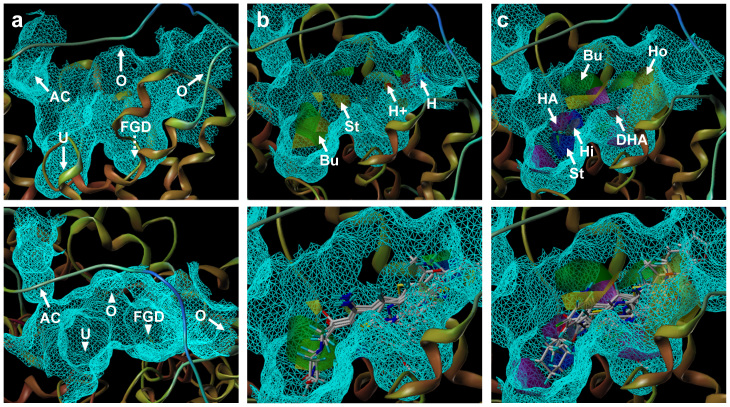
The chosen CoMFA and CoMSIA models were used to generate a QSAR contour map (Figure 7). The binding pocket of UT-B inhibitors can be primary divided into three parts: urea channel (U), functional group docking (FGD) site (containing TRP286 and ASN289) and allosteric channel (AC) (Figure 7a). The original hypothesis is that FGD provides a pocket for UT-B inhibitor binding. However, only PU21 can anchor to FGD. Compared to the contour fields, the steric favored contours (green) are anchored near the UT-B-binding site, whereas the bulk favored contours (green) are close to the UT-B inhibitor binding sites (Figure 7b). Electrostatics (H+) that favored contours (blue) are located near the opening of the binding site (O). No contour is located in AC and FGD. The CoMSIA contour map shows a hydrogen bond acceptor (HA) favored contour (magenta) is located near FGD, that matches the functional group properties of PU21 and allows PU21 to form hydrogen bonds to TRP286 and ASN289 (Figure 7c). Hydrophobic (Ho) favored contours (yellow) and hydrophobic disfavored contours (white) are located near the terminals of the inhibitor binding site. The correlation coefficients (R2) are 0.796 and 0.812 for CoMFA and CoMSIA models (Figure 6c, d), respectively, which indicates suitable bioactivity prediction. The range of residuals between observed pIC50 and predicted pIC50 is < ± 1.2.
Figure 7.
(a) Side view (top) and top view (bottom) of UT-BI binding site. AC represents allosteric channel, U represents urea binding site, FGD represents functional group docking (FGD) site, O represents the opening of binding site. (b) CoMFA contour maps, four contours represent steric favored contour (St, yellow), Bulk favored contour (Bu, green), electrostatics favored contour (H+, blue) and Electrostatics disfavored contour (H, red). (c) CoMSIA contour maps, six contours represent hydrogen bond acceptor favored contour (HA, magenta) and disfavored contour (DHA, red), hydrophobic favored contours (Ho, yellow) and hydrophobic disfavored contours (Hi, white), steric favored contour (St, blue) and bulk favored contour (Bu, green). The cartoon graph of CoMSIA illustrates the contour location inside the UT-BI binding site.
Molecular dynamic simulation
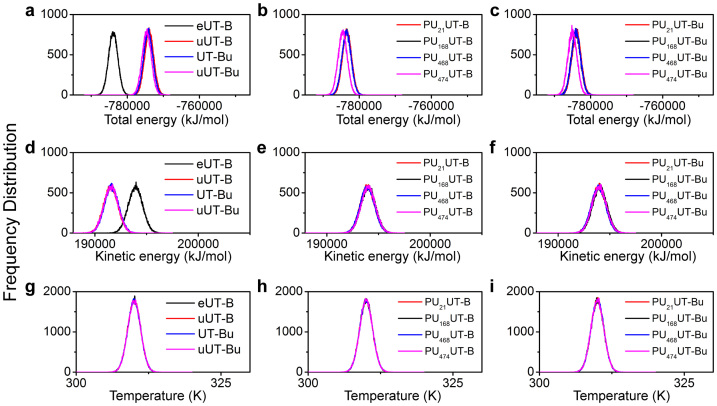
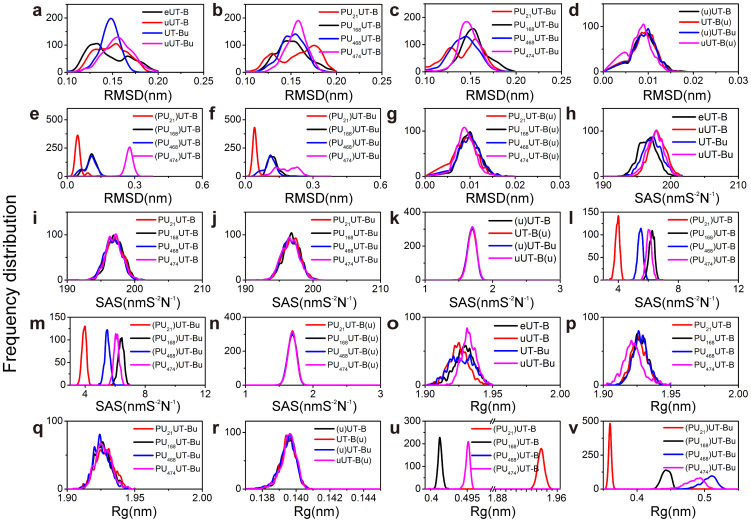
The mean root-mean-square deviation (RMSD) of eUT-B (video 1) is 0.143 nm. The eUT-B shows the lowest total energy of mean −783,917 KJ/mol (Figure 8a) and the highest kinetic energy of 193,919 KJ/mol (Figure 8d). Compared to the 0.146 nm of uUT-B (video 2), 0.144 nm of UT-Bu (video 3) and 0.153 nm of uUT-Bu, although the extracellular urea leaves the urea binding site after 2 ns (video 4), eUT-B is relatively stable (Figure 9a). When two urea exist, the UT-B is even more unstable than a single UT-B (Figure 9d). There is no significant differences between the mean RMSD of the inhibitor bound and inhibitor unbound urea combined at the intracellular binding site (Figure 9b, c). Therefore the function of urea at this binding site cannot be proved by RMSD. PU21 has a higher stability in PU21UT-B (video 5) and PU21UT-Bu (video 6), but the UT-B of PU21 in unbound urea has a higher radius of gyration (mean Rg > 1.9 nm) (Figure 9p). In PU21 UT-Bu, Rg of PU21 reduces to below 0.2 nm (Figure 9q). Therefore, when urea is lacking, PU21 tends to self-unfold. Furthermore, the relation between PU21 and solvent with water molecules in bound and unbound UT-B are relatively low (Figure 9l, m) in which the solvent accessible surface area (SAS) is 3.920 and 3.912 nm S−2N−1, respectively. This proves that a binding site of PU21 can be surrounded by FGD and lower the reaction surface between PU21 and the water molecules.
Figure 8. Physical properties of the molecular dynamics environment.
(a–c) Total energy, (d–f) kinetic energy and (g–i) temperature were calculated. All complexes were performed at constant temperature. Total energy and kinetic energy shows the stability of the system. UT-B without ligand shows a relatively stable system compared to urea. Total energy decreased while the ligand was binding with UT-B, either in urea treated and untreated conditions.
Figure 9.
(a–g) Root-mean-square deviation (RMSD) analysis of UT-B complexes. (h–n) Solvent accessible surface area (SAS) analysis of UT-B complexes. (o–v) Radius of gyration (Rg) analysis of UT-B complexes. By calculating the distribution of RMSD, we can estimate the conformational changing frequency of UT-B compared with UT-B initial state. Calculating SAS provides interaction detail between solvent and molecule, which reflects the changes in the binding site surface area. The radius of gyration was often used to measure protein density.
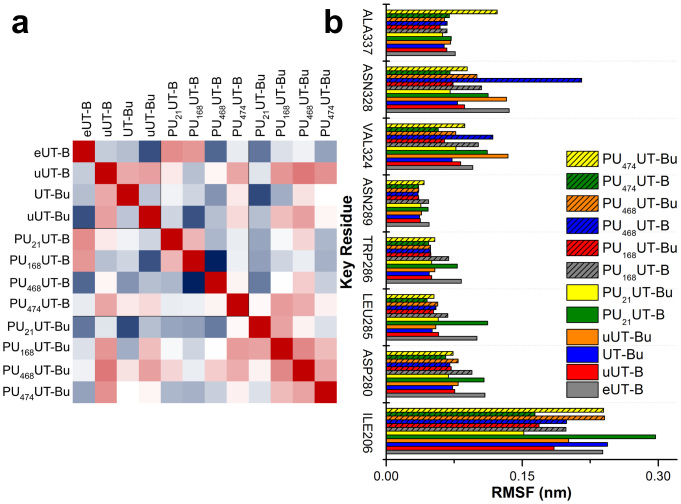
Root mean square fluctuations (RMSF) were calculated to study the stability of individual residues in independent systems. The correlations between independent systems were then calculated to find functional changes caused by system differences (Figure 10). The urea in complex uUT-B has the functions of urea in UT-Bu and uUT-Bu (Figure 10a). However, the correlation coefficient (R2 = 0.6848) between UT-Bu and uUT-Bu is lower. The overall uUT-B mean RMSF is 0.0790 nm, which is lower than the 0.0811 nm of UT-Bu. This indicates that the urea located at the extracellular binding site is far more able to stabilize the UT-B structure than intracellular urea urea. A high RMSF correlation exists between eUT-B and PU168UT-B (video 7) as well as PU21UT-B, which are R2 = 0.8417 and R2 = 0.852, respectively. A high degree of correlation is produced between PU168UT-Bu (video 8) and uUT-B as well as uUT-Bu (R2 = 0.842, R2 = 0.801). PU474UT-B (video 9), on the other hand, has a high level of correlation between uUT-B and uUT-Bu; R2 = 0.826 and R2 = 0.770, respectively. This indicates that PU474UT-B has a similar effect to urea in uUT-B and produces a similar induced-fit mechanism. PU168 being at the intracellular urea bounded UT-B, causes PU168 to produce the same functions as the urea of uUT-B (R2 = 0.842) in the PU168UT-Bu. There is a very high mutual correlation between PU168UT-Bu, PU468UT-Bu (video 10), and PU474UT-Bu, whereas PU21UT-Bu only produces a high correlation with PU168UT-Bu (R2 = 0.829), with molecular mechanisms similar to, but not the same as, those of PU168. On the contrary, PU21UT-Bu is different from all urea bound UT-B and inhibitor bound UT-B (RMSF = 0.0835 nm). Therefore, it can be inferred that the inhibitor produces different mechanisms in PU21UT-Bu, and the urea in PU21UT-Bu may induce this change in mechanism to occur, making conformation of PU21UT-B transform.
Figure 10.
(a) Heat map of root mean square fluctuation (RMSF) of UT-B complexes. The correlation between UT-B complexes were calculated and ranked by coefficient correlation (R2), in which the highest R2 is 1 (red), medium is white and the lowest is presented in blue. (b) RMSF of UT-B key residues in each complex, ALA337, ASN328, VAL324, ASN289, TRP286, LEU285, ASP280 and ILE206 are shown. The individual values contained in a matrix were used to demonstrate how inhibitors influence UT-B and estimate the common mechanism.
ILE206 reacts with PU168UT-B, PU21UT-B and PU468UT-B (video 11) and produces hydrogen bonds (Figure 11a). The hydrogen bonds produced by PU21 have the highest frequency (9%) (Table 7). The RMSF of ILE206 in PU21UT-B is 0.297 nm, which is the highest in all complexes (Figure 10b). ASP280 participates in inter-reactions with complex UT-B inhibitor other than PU168UT-B and PU474UT-B. The PU21UT-Bu hydrogen bond frequency is the highest (33.9%) and the occurrence frequency of 21.5% of PU21UT-B is the second highest (Figure 11b). ASP280 RMSF is highest with eUT-B and PU21UT-B, being 0.109 nm and 0.108 nm, respectively (Figure 10b). TRP286 participates in hydrogen bond formation between PU21UT-Bu and PU21UT-B with 83.9% and 3.1% occurrence rates, and also participates in hydrogen bond formation between PU474UT-B and PU468UT-B (11% and 5.1%) (Figure 11d). The RMSF of TRP286 eUT-B and PU21UT-B are 0.083 nm and 0.078 nm. The RMSF of ASN328 in PU468UT-B is 0.216 nm, as well as 0.1 nm and 0.136 nm in PU468UT-Bu and eUT-B (Figure 10b). ALA337 forms hydrogen bonds with PU168UT-B and PU168UT-Bu, which are 56.5% and 15%, respectively (Figure 10h). In addition, ALA337 also forms hydrogen bonds with PU474UT-Bu (9%), the RMSF in PU478UT-Bu (video 12) also being the highest (0.1224 nm).
Figure 11. Hydrogen bond distance measurement between UT-B-inhibitors and UT-B, residues include (a) ILE206, (b) ASP280, (c) LEU285, (d) TRP286, (e) ASN 289, (f) VAL324, (g) ASN328 and (h) ALA337.
The cutoff distance of hydrogen bond generation was set to 0.35 nm.
Table 7. Hydrogen bond percentage calculated between UT-B inhibitor and UT-B.
| Key Residue | ||||||||
|---|---|---|---|---|---|---|---|---|
| ILE206 | ASP280 | LEU285 | TRP286 | ASN289 | VAL324 | ASN328 | ALA337 | |
| (PU21)UT-B | 9 | 21.5 | 0 | 3.1 | 2.9 | 0.5 | 17.3 | 0 |
| (PU168)UT-B | 0.8 | 0 | 0 | 0 | 0 | 0 | 2 | 56.5 |
| (PU468)UT-B | 5.1 | 1.9 | 0 | 5.1 | 0 | 0 | 3.7 | 0 |
| (PU474)UT-B | 0 | 0 | 12.5 | 11 | 30.3 | 0 | 5 | 0 |
| (PU21)UT-Bu | 0 | 33.9 | 0 | 83.9 | 1.3 | 0 | 0 | 0 |
| (PU168)UT-Bu | 0 | 10.9 | 0 | 6.5 | 0 | 0 | 22.7 | 15 |
| (PU468)UT-Bu | 0.6 | 1.3 | 0 | 3.9 | 0 | 0 | 17.1 | 0 |
| (PU474)UT-Bu | 0 | 0.2 | 0 | 0 | 27.7 | 0 | 1.4 | 9 |
Discussion
Comparing RMSF with the UT-B complex key residue using eUT-B as the control group shows that besides PU21UT-B, all the others have a trend of reduction (Figure 10b). Comparing the correlation between PU21UT-B and PU21UT-Bu using the above method, it was found that PU21 was not able to bind the extracellular urea binding site (correlation of eUT-B, R2 = 0.852) like the other three UT-B inhibitors, and that the other UT-B inhibitors can simulate urea (Figure 10a). The PU21 radius of gyration is larger than 1.9 nm, whereas the solvent accessible surface area is lower than 4.0 nmS−2N−1. Therefore, the PU21 function group can bind to FGD, which provides protection as well as allowing the function group to produce more bonds using the advantage of the radius of gyration. On the other hand, results suggest that PU168, PU468 and PU474 can perform a similar role as extracellular urea. Although in the W286G mutation model, the binding affinity of both PU168 and PU474 increases, they participate in the formation of hydrogen bonds in a stable manner in molecular dynamics simulation. Residues that participate in the formation of PU21 hydrogen bonds include ASP280, ASN289, LEU285, and VAL324, none of them can reduce inhibitor binding stability. In W286A mutation tests, the bonding strength between PU21 and UT-B drops from 46.437 to 43.198. In W286G, the bonding strength of PU21 drops to 42.752. In the D280A test, the PU21 bonding strength drops to 43.549. Therefore, it can be inferred that ASP280 and TRP286 can both increase and decrease inhibitor binding stability.
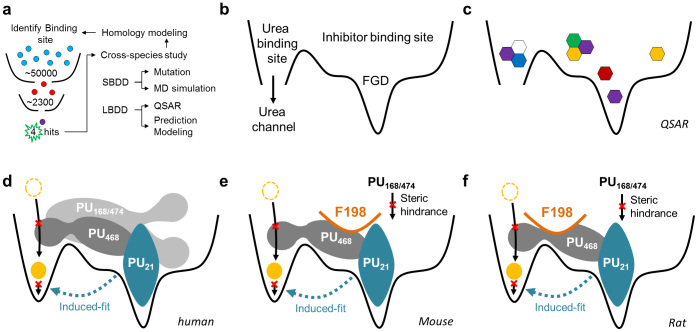
In conclusion, computational modeling was primarily used to predict inhibitor binding sites. Four UT-B inhibitors; PU21, PU168, PU468 and PU474 were identified via HTVS and high throughput screening by using an erythrocyte osmotic lysis assay and in silico methods (Figure 12a). By integrating structure-based and QSAR, potential cryptic binding pockets, such as FGD, were discovered that could be important in anchoring an inhibitor (Figure 12b–c). The species comparison study discovered inhibitory activity differences between human, rat and mouse UT-B (Figure 12d–f). Binding affinity calculation suggests that PHE198 might block the inhibitor migration pathway, leading to a decrease in inhibitory activity. Molecular dynamics simulation provided evidence of an inhibitor binding mechanism. Predominately, PU168, PU468 and PU474 were predicted to exhibit a similar induced-fit mechanism of urea in the urea binding site. PU21 likely produced a remarkable anchoring function in the UT-B FGD domain, in both the PU21UT-B and PU21UT-Bu complex system. Moreover, key residues including ASP280, TRP286 and ASN289 were identified by a structure-based study, and were double validated by simulation and in silico mutation studies. This pioneer study provides a structural basis for future lead identification and optimization.
Figure 12.
(a) Flow chart of this investigation. A small molecule database is employed to identify UT-B inhibitors via HTVS and high-throughput screening. (b) Inhibitors were used to map novel inhibitor binding sites by in silico methods. Inhibitor binding site was found to overlap a part of the urea binding site. A cryptic binding pocket, such as FGD, was discovered to be important in anchoring an inhibitor that contains residues TRP286 and ASN289. (c) Quantitative structure activity relationship suggested a hydrogen bond acceptor favored property is located near FGD which provides proper interaction pocket to PU21. The inhibition mechanism hypothesis was supported by fine-grained molecular dynamics. (d) All atom simulations suggest small inhibitors, such as PU21, might generate induced-fit mechanisms in urea transportation blocking. By generating steric hindrance directly towards urea binding site, other larger inhibitors are able to generate inhibition activity similar to PU21. This cross-species study discovered that the migration pathway of PU168 and PU474 might be interrupted by residue PHE198 in either (e) mouse or (f) rat model.
Methods
High-Throughput Virtual Screening
UT-B protein structure used in docking was downloaded from Protein Data Bank (PDB: 4EZD)19. Human UT-B was then input to generate a homology model22 by using Bos taurus (Bovine) UT-B sequence as a template (Swissprot entry: Q13336. Species: human23). BLOSUM24 was chosen to be used as a multiple alignment scoring matrix with a 10 gap open penalty. Validation server RAMPAGE was used to verify validity of the predicted model25,26. The urea binding sites in human UT-B were then defined and side chains were also optimized. Three hypothetical sites were predicted to filter the 50,000 small-molecular drug-like compounds from the Asinex database, one of these hypothetical sites was later evaluated by UT-B inhibitors.
Compounds for screening
50,000 small-molecular drug-like compounds were screened from a database and 2,319 compounds were identified and purchased from a commercial chemical company (Asinex, Russia). These 2319 compounds were resolved and stored in 10 mM in dimethyl sulfoxide (DMSO).
Collection of human, rat, and mouse blood
Vein blood was collected from humans, SD rats, wild-type mice or UT-B-null mice as described previously [21].
UT-B Inhibitor Identification by High-Throughput Screening
High-throughput screening assay was performed for identification of UT-B inhibitors using erythrocytes, which originally express UT-B as described previously27. Erythrocytes were diluted to a hematocrit value of 2% in hyperosmolar PBS containing 1.25 M acetamide and 5 mM glucose. Erythrocyte suspensions were preserved at room temperature for 2 h by periodic pipette mixture. Then, 99 μl erythrocyte suspension from a reservoir was added to each well of a 96-well round-bottom microplate, to which test compounds were added (1 μl, 10 μM final compound concentration, 1% final DMSO concentration). After 6 min of incubation, 20 μl of the erythrocyte suspension was added rapidly to each well of a 96-well black-walled plate containing 180 μl isomolar buffer (PBS containing 1% DMSO) in each well. Erythrocyte lysis was quantified from a single time point measure of absorbance at 710 nm wavelength with a plate reader (BioTek)27.
The percentage of erythrocyte lysis in each test well was calculated using control values from the same plate as: % lysis = 100%. (Aneg-Atest)/(Aneg-Apos), where Atest is the absorbance value from a test well. Nonspecific UT-B inhibitor phloretin (Sigma-Aldrich, 700 μM final concentration) was added as an additional positive control.
Structure-based drug design
Twenty compounds were prepared for a Monte Carlo docking simulation28. Force field CHARMm29,30 was employed to start minimization. A receptor-rigid docking algorithm (LigandFit) was employed to calculate ligand binding affinity, in which minimized docking poses were then clustered with 1.5 RMS Threshold for Diversity31. Scoring functions such as the potential of mean force (PMF)32, Jain and Piecewise Linear Potential 1/2 (PLP1/2)33 were used to validate the major determinate-Dock Score (Dock Score = - ligand/receptor interaction energy + ligand internal energy). A mutation study was employed to evaluate the role of key residues by generating seven mutation models that were used for further re-docking34. Results were further used to produce a scaffold for molecular dynamics simulation.
Ligand-based drug design
Activity was predicted using QSAR models35. This study establishes activity prediction models for Ligand prediction using compounds with UT-B inhibitory activity screened by the erythrocyte osmotic lysis assay. The chemical properties for the compounds were calculated through DS 2.5, and more than 200 descriptors were produced. Then, genetic function approximation (GFA) was used to filter out and select descriptors with higher relevance, and the square correlation coefficient (r2) was used for ordering and selection36. Training sets and test sets were obtained by random allocation of the descriptors selected through GFA (Table S1) along with the IC50s of the sixteen analogues of PU21 [Ren et al., under review]. Support Vector Machine (SVM) and Multiple Linear Regression (MLR)37, respectively, used LibSVM38 and MATLAB (MATrix LABoratory, Natick, MA, US: The MathWorks Inc.) to establish linear and non-linear models. 3D-QSAR models were established to understand the structural characteristics of the compounds. Comparative force field analysis (CoMFA) was used to study steric and electrostatic properties. Comparative similarity indices analysis (CoMSIA) was used to study steric, electrostatic, hydrophobic, hydrogen donor and acceptor properties. The training set and test set used the atom-fit module of SYBYL-X 1.1 (St Louis, M. USA: Tripos.) to conduct scaffold alignment. Then, CoMFA and CoMSIA models were established. Coulombic potential and Lennard-Jones potential (LJP) were used to calculate electrostatic fields and steric fields, respectively. Gaussian functions were used to calculate steric, hydrogen bond acceptor and donor, hydrophobic and electrostatic fields in the CoMSIA model. From the results of the partial least squares (PLS) analysis, the conventional correlation coefficient (r2) and cross-validated coefficient (q2) were produced, which were used to evaluate the accuracy of non-cross validation and cross validation models, respectively39. All tested SVM, MLR, and 3D-QSAR models were used to predict the activity of the predicted sets.
Molecular Dynamics
The experiment was divided into three portions that simulated the structural and dynamic differences of UT-B under normal conditions when inhibitors exist. Unbound UT-B (eUT-B), UT-B bound with single urea (uUT-B and UT-Bu, in which uUT-B represents urea binding in the extracellular binding site close to the inhibitor binding site), and UT-B bound with double urea (uUT-Bu) were used to simulate UT-B states under normal functionality. Four systems were used to simulate the effects of inhibitors in UT-B (PU21, PU168, PU468 and PU474). In addition, four systems were used to simulate the situation in which urea and inhibitors both exist in UT-B (PU21UT-Bu, PU168UT-Bu, PU468UT-Bu, PU474UT-Bu). Force field CHARMm2740 and parameters were added to each ligand by using SwissParam41 and the pdb2gmx protocol of Gromacs version 4.542. Coupled ligand-UT-B complex and uUT-Bu complex, ligand-UT-B-urea complex were used to generate a cubic box and to immerse into a buffer solution (solvated with TIP3P water model)43,44. Mean square of displacement (MSD) was used to demonstrate the diffusion of molecules in the system (Figure 13). The distance between the edge of the cubic box and complex was set to 1.2 nm. 0.145 M NaCl ions were added to neutralize the system. A steepest descent algorithm was calculated for minimization, and minimization would stop when max(|Fn|) < ε or defined minimization steps had been approached. Maximum steepest descents minimization was set to 5,000 time steps. For the equilibration, the last configuration of energy-minimization was used to generate restrained dynamics production. NVT equilibration, Particle-Mesh Ewald (PME) and Berendsen weak thermal coupling methods were used in dynamics production, whereas PME was also used in the calculation of electrostatic interactions. The time step was set at 2 fs under the PME option, where the cut-off for PME was 1.0 nm. Simulation trajectories analysis was conducted by plug-in open source methods.
Figure 13. Mean square displacement (MSD) of UT-B complexes and ligands that measure the random motion of urea, ligand and UT-B.
The MSD determines how the UT-B complex diffuses in the solvent system.
Ethics Statement
All experiments were carried out in accordance with the Regulations for the Administration of Affairs Concerning Experimental Animals of Peking University. The experimental protocol was approved by ethics committee of Peking University. For experiments with human erythrocytes, the informed consent was obtained from all subjects.
Supplementary Material
video 1
video 2
video 3
video 4
video 5
video 6
video 7
video 8
video 9
video 10
video 11
video 12
Supplementary file
Acknowledgments
This work was supported by National Natural Science Foundation of China grants 31200869, 81261160507, 81330074, and 81170632, the 111 Project, and International Science & Technology Cooperation Program of China 2012DFA11070. The research was also supported by grants from the National Science Council of Taiwan (NSC102-2325-B039-001, NSC102-2221-E-468-027-), Asia University (ASIA100-CMU-2, ASIA101-CMU-2, 102-Asia-07), and China Medical University Hospital (DMR-103-058, DMR-103-001, DMR-103-096). This study is also supported in part by Taiwan Department of Health Clinical Trial and Research Center of Excellence (DOH102-TD-B-111-004), Taiwan Department of Health Cancer Research Center of Excellence (MOHW103-TD-B-111-03), and CMU under the Aim for Top University Plan of the Ministry of Education, Taiwan. Finally, our gratitude goes to Dr. Tim Williams, Asia University.
Footnotes
The authors declare no competing financial interests.
Author Contributions M.L., W.I.T., C.Y.C.C. and B.Y. conceived and designed the experiments. M.L. and W.I.T. performed the experiments. M.L., W.I.T., C.Y.C.C. and B.Y. analyzed the data. M.L., W.I.T., C.Y.C.C., B.Y., H.Z., F.L. and H.R. contributed reagents/materials/analysis tools. M.L., W.I.T., C.Y.C.C. and B.Y. wrote the paper.
References
- Tsukaguchi H. et al. Cloning and characterization of the urea transporter UT3: localization in rat kidney and testis. J Clin Invest 99, 1506–15 (1997). [DOI] [PMC free article] [PubMed] [Google Scholar]
- Couriaud C., Ripoche P. & Rousselet G. Cloning and functional characterization of a rat urea transporter: expression in the brain. Biochim Biophys Acta 1309, 197–9 (1996). [DOI] [PubMed] [Google Scholar]
- Timmer R. T. et al. Localization of the urea transporter UT-B protein in human and rat erythrocytes and tissues. Am J Physiol Cell Physiol 281, C1318–25 (2001). [DOI] [PubMed] [Google Scholar]
- Liu Y. et al. 1,1-Difluoroethyl-substituted triazolothienopyrimidines as inhibitors of a human urea transport protein (UT-B): new analogs and binding model. Bioorg Med Chem Lett 23, 3338–41. [DOI] [PMC free article] [PubMed] [Google Scholar]
- Bankir L., Bouby N., Trinh-Trang-Tan M. M., Ahloulay M. & Promeneur D. Direct and indirect cost of urea excretion. Kidney Int 49, 1598–607 (1996). [DOI] [PubMed] [Google Scholar]
- Bankir L. & Yang B. New insights into urea and glucose handling by the kidney, and the urine concentrating mechanism. Kidney Int 81, 1179–98 (2012). [DOI] [PubMed] [Google Scholar]
- Sands J. M. Mammalian urea transporters. Annu Rev Physiol 65, 543–66 (2003). [DOI] [PubMed] [Google Scholar]
- Promeneur D. et al. Evidence for distinct vascular and tubular urea transporters in the rat kidney. J Am Soc Nephrol 7, 852–60 (1996). [DOI] [PubMed] [Google Scholar]
- Cafferkey R. et al. Dominant missense mutations in a novel yeast protein related to mammalian phosphatidylinositol 3-kinase and VPS34 abrogate rapamycin cytotoxicity. Mol Cell Biol 13, 6012–23 (1993). [DOI] [PMC free article] [PubMed] [Google Scholar]
- Yang B., Bankir L., Gillespie A., Epstein C. J. & Verkman A. S. Urea-selective concentrating defect in transgenic mice lacking urea transporter UT-B. J Biol Chem 277, 10633–7 (2002). [DOI] [PubMed] [Google Scholar]
- Bankir L., Chen K. & Yang B. Lack of UT-B in vasa recta and red blood cells prevents urea-induced improvement of urinary concentrating ability. Am J Physiol Renal Physiol 286, F144–51 (2004). [DOI] [PubMed] [Google Scholar]
- Yang B. & Verkman A. S. Analysis of double knockout mice lacking aquaporin-1 and urea transporter UT-B. Evidence for UT-B-facilitated water transport in erythrocytes. J Biol Chem 277, 36782–6 (2002). [DOI] [PubMed] [Google Scholar]
- Fenton R. A., Chou C. L., Stewart G. S., Smith C. P. & Knepper M. A. Urinary concentrating defect in mice with selective deletion of phloretin-sensitive urea transporters in the renal collecting duct. Proc Natl Acad Sci U S A 101, 7469–74 (2004). [DOI] [PMC free article] [PubMed] [Google Scholar]
- Lei T. et al. Role of thin descending limb urea transport in renal urea handling and the urine concentrating mechanism. Am J Physiol Renal Physiol 301, F1251–9 (2011). [DOI] [PMC free article] [PubMed] [Google Scholar]
- Liu Y. et al. 1,1-Difluoroethyl-substituted triazolothienopyrimidines as inhibitors of a human urea transport protein (UT-B): new analogs and binding model. Bioorg Med Chem Lett 23, 3338–41 (2013). [DOI] [PMC free article] [PubMed] [Google Scholar]
- Sands J. M. Urea transporter inhibitors: en route to new diuretics. Chem Biol 20, 1201–2 (2013). [DOI] [PMC free article] [PubMed] [Google Scholar]
- Yao C. et al. Triazolothienopyrimidine inhibitors of urea transporter UT-B reduce urine concentration. J Am Soc Nephrol 23, 1210–20 (2012). [DOI] [PMC free article] [PubMed] [Google Scholar]
- Knepper M. A. & Miranda C. A. Urea channel inhibitors: a new functional class of aquaretics. Kidney Int 83, 991–3 (2013). [DOI] [PMC free article] [PubMed] [Google Scholar]
- Levin E. J. et al. Structure and permeation mechanism of a mammalian urea transporter. Proc Natl Acad Sci U S A 109, 11194–9 (2012). [DOI] [PMC free article] [PubMed] [Google Scholar]
- Levin E. J., Quick M. & Zhou M. Crystal structure of a bacterial homologue of the kidney urea transporter. Nature 462, 757–61 (2009). [DOI] [PMC free article] [PubMed] [Google Scholar]
- Li F. et al. A novel small-molecule thienoquinolin urea transporter inhibitor acts as a potential diuretic. Kidney Int 83, 1076–86 (2013). [DOI] [PubMed] [Google Scholar]
- Salituro G. M. et al. Meridamycin: A novel nonimmunosuppressive FKBP12 ligand from streptomyces hygroscopicus. Tetrahedron Letters 36, 997–1000 (1995). [Google Scholar]
- Boeckmann B. et al. The SWISS-PROT protein knowledgebase and its supplement TrEMBL in 2003. Nucleic Acids Res 31, 365–70 (2003). [DOI] [PMC free article] [PubMed] [Google Scholar]
- Henikoff S. & Henikoff J. G. Amino acid substitution matrices from protein blocks. Proc Natl Acad Sci U S A 89, 10915–9 (1992). [DOI] [PMC free article] [PubMed] [Google Scholar]
- Lovell S. C. et al. Structure validation by Calpha geometry: phi,psi and Cbeta deviation. Proteins-Structure Function and Bioinformatics 50, 437–50 (2003). [DOI] [PubMed] [Google Scholar]
- Eisenberg D., Luthy R. & Bowie J. U. VERIFY3D: assessment of protein models with three-dimensional profiles. Methods Enzymol 277, 396–404 (1997). [DOI] [PubMed] [Google Scholar]
- Mazeron P., Didelon J., Muller S. & Stoltz J. F. A theoretical approach of the measurement of osmotic fragility of erythrocytes by optical transmission. Photochem Photobiol 72, 172–8 (2000). [DOI] [PubMed] [Google Scholar]
- Sharpless K. B. et al. The osmium-catalyzed asymmetric dihydroxylation: a new ligand class and a process improvement. The Journal of Organic Chemistry 57, 2768–2771 (1992). [Google Scholar]
- Brooks C. Assessing, improving and using grid-based docking algorithms in CHARMM. Abstracts of Papers of the American Chemical Society 233, 285–285 (2007). [Google Scholar]
- Brooks B. R. et al. Charmm - a Program for Macromolecular Energy, Minimization, and Dynamics Calculations. Journal of Computational Chemistry 4, 187–217 (1983). [Google Scholar]
- Venkatachalam C. M., Jiang X., Oldfield T. & Waldman M. LigandFit: a novel method for the shape-directed rapid docking of ligands to protein active sites. Journal of Molecular Graphics & Modelling 21, 289–307 (2003). [DOI] [PubMed] [Google Scholar]
- Hao M. H., Haq O. & Muegge I. Torsion angle preference and energetics of small-molecule ligands bound to proteins. J Chem Inf Model 47, 2242–52 (2007). [DOI] [PubMed] [Google Scholar]
- Gehlhaar D. K. et al. Molecular Recognition of the Inhibitor Ag-1343 by Hiv-1 Protease - Conformationally Flexible Docking by Evolutionary Programming. Chemistry & Biology 2, 317–324 (1995). [DOI] [PubMed] [Google Scholar]
- Chang Y. S. et al. Stapled α-helical peptide drug development: A potent dual inhibitor of MDM2 and MDMX for p53-dependent cancer therapy. Proceedings of the National Academy of Sciences 110, E3445–E3454. [DOI] [PMC free article] [PubMed] [Google Scholar]
- So S. S. & Karplus M. Evolutionary optimization in quantitative structure-activity relationship: an application of genetic neural networks. J Med Chem 39, 1521–30 (1996). [DOI] [PubMed] [Google Scholar]
- Rogers D. & Hopfinger A. J. Application of Genetic Function Approximation to Quantitative Structure-Activity-Relationships and Quantitative Structure-Property Relationships. Journal of Chemical Information and Computer Sciences 34, 854–866 (1994). [Google Scholar]
- Slinker B. K. & Glantz S. A. Multiple linear regression - Accounting for multiple simultaneous determinants of a continuous dependent variable. Circulation 117, 1732–1737 (2008). [DOI] [PubMed] [Google Scholar]
- Chang C. C. & Lin C. J. LIBSVM: A Library for Support Vector Machines. Acm Transactions on Intelligent Systems and Technology 2 (2011). [Google Scholar]
- Stanton D. T. QSAR and QSPR Model Interpretation Using Partial Least Squares (PLS) Analysis. Current Computer-Aided Drug Design 8, 107–127 (2012). [DOI] [PubMed] [Google Scholar]
- Sapay N. & Tieleman D. P. Combination of the CHARMM27 Force Field with United-Atom Lipid Force Fields. Journal of Computational Chemistry 32, 1400–1410 (2011). [DOI] [PubMed] [Google Scholar]
- Tao R. et al. Deacetylase inhibition promotes the generation and function of regulatory T cells. Nat Med 13, 1299–307 (2007). [DOI] [PubMed] [Google Scholar]
- Fadden P. et al. Application of Chemoproteomics to Drug Discovery: Identification of a Clinical Candidate Targeting Hsp90. Chemistry & Biology 17, 686–694 (2010). [DOI] [PubMed] [Google Scholar]
- Sun Y. X. & Kollman P. A. Hydrophobic Solvation of Methane and Nonbond Parameters of the Tip3p Water Model. Journal of Computational Chemistry 16, 1164–1169 (1995). [Google Scholar]
- Huggins J. P., Pelton J. T. & Miller R. C. The structure and specificity of endothelin receptors: Their importance in physiology and medicine. Pharmacology & Therapeutics 59, 55–123 (1993). [DOI] [PubMed] [Google Scholar]
Associated Data
This section collects any data citations, data availability statements, or supplementary materials included in this article.
Supplementary Materials
video 1
video 2
video 3
video 4
video 5
video 6
video 7
video 8
video 9
video 10
video 11
video 12
Supplementary file


