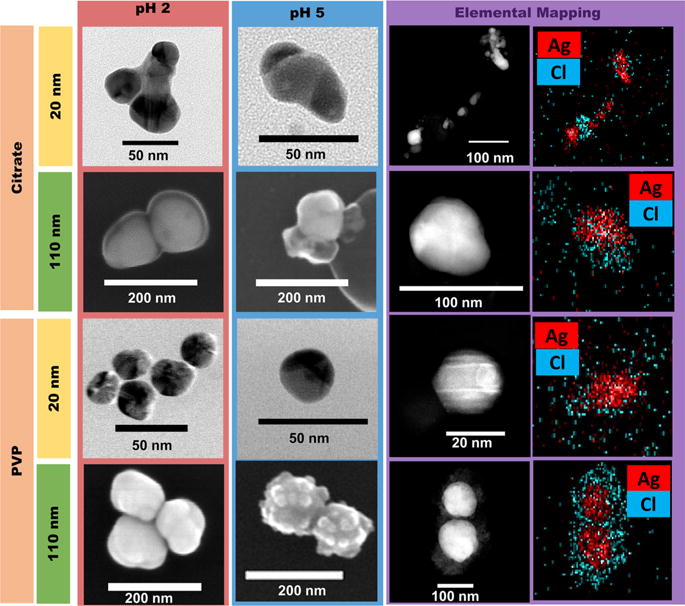
Figure 8.

TEM images of 20 nm (yellow) AgNP and SEM images of 110 nm (green) AgNP after being digested in SGF of pH 2 (red) and pH 5 (blue) for a period of 10 min. Elemental mapping (right) using TEM/EDX (purple) shows the distribution of these elements on the particles.
