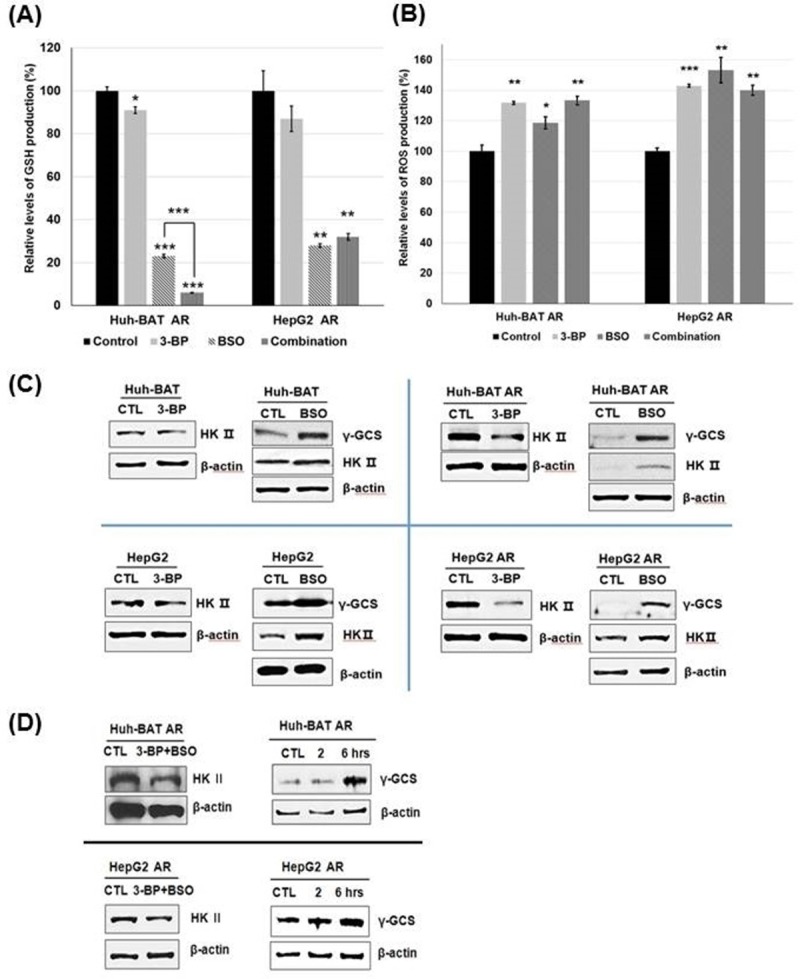
Fig 3. Changes of ROS and glutathione levels following 3-BP, BSO, or a combination treatment.

(A) GSH production was significantly suppressed after BSO or a combination treatment of 3-BP and BSO compared to the control in AR Huh-BAT and AR HepG2 cells. (B) ROS production was significantly increased by 3-BP, BSO, and a combination treatment of 3-BP and BSO compared to the control. (C) Expression of HK II was decreased after 3-BP treatment and increased after BSO treatment. Expression of rGCS was increased after BSO treatment. (D) Following treatment with a combination of 3-BP and BSO, HK II expression was suppressed, and rGCS expression was increased compared to the control. Each assay and western blotting were performed at condition of 3-BP treatment 40 μM, 12 hour; BSO 200 μM, 24 hours; a combination treatment at 3-BP 40 μM, 12 hours after 24 hours pre-exposure of BSO 200 μM. *P<0.05; **P<0.01; ***P<0.001. Abbreviation: AR, anoikis-resistant; BSO, buthionine sulfoximine; CTL, control; GSH, glutathione; HK II, hexokinase II; rGCS, gamma-glutamylcysteine synthetase; ROS, reactive oxygen species; 3-BP, 3-bromopyruvate.
