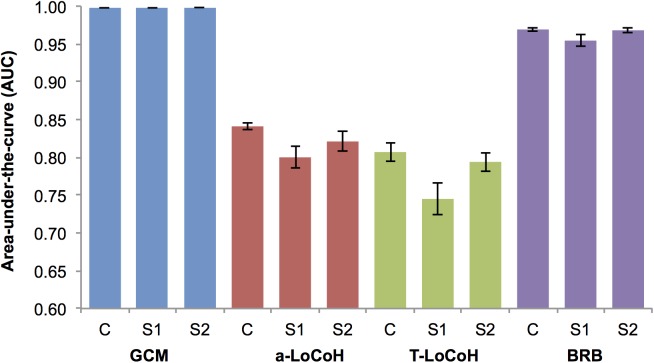
Fig 3. Mean (±SE) area-under-the-curve for the home range estimators (N = 10 individuals).
Grid-cell method (GCM—blue), adaptive local convex hull (a-LoCoH—red), adaptive time local convex hull (T-LoCoH—green) and biased random bridges (BRB—purple), using the complete data set (C) and the simulated scenarios, with a decreased sampling interval (S1 = fixes every 4 hours), and simulating random failures (S2).

