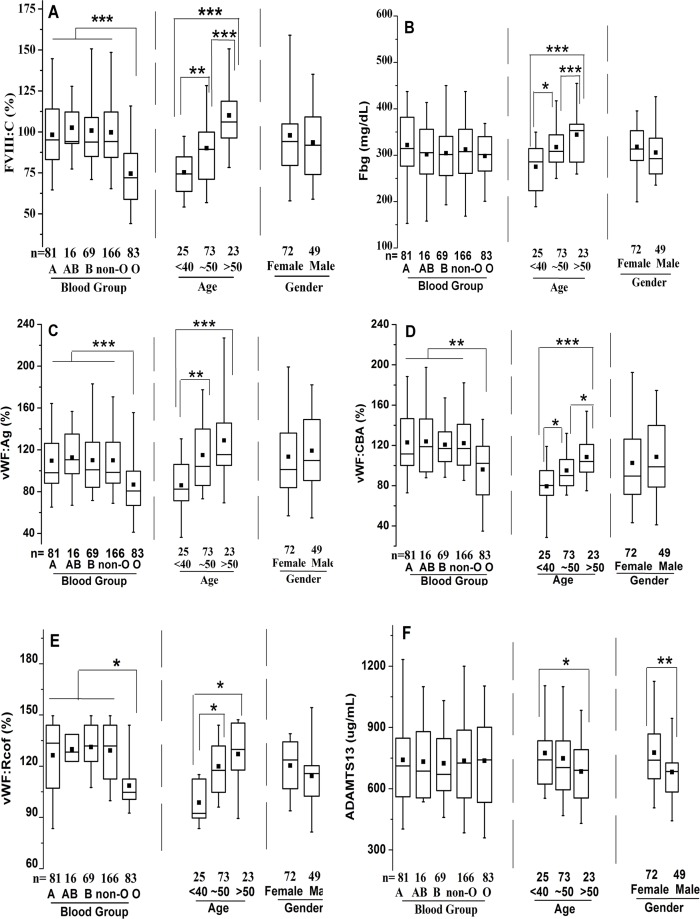
Figure 1. Effects of ABO type, age, and gender on distribution of plasma FVIII:C, Fbg, VWF:Ag, VWF:CBA, VWF:Rcof, and ADAMTS13 antigen levels.
The box plots encompass the 25th–75th quartiles, with the center lines (—) representing the median values and the solid boxes (■) showing the mean values. The whisker plots represent 95% CI. ∗p < 0.05; ∗∗p < 0.01; ∗∗∗p < 0.001. The effects of ABO type and age were calculated using one-way ANOVA followed by LSD post hoc test, whereas the influence of gender was calculated using two-tailed unpaired Student’s t-tests. Non-O group is composed of A, B and AB groups. (A) FVIII:C; (B) Fbg; (C) VWF:Ag; (D) VWF:CBA; (E) VWF:Rcof; (F) ADAMTS13 antigen.

