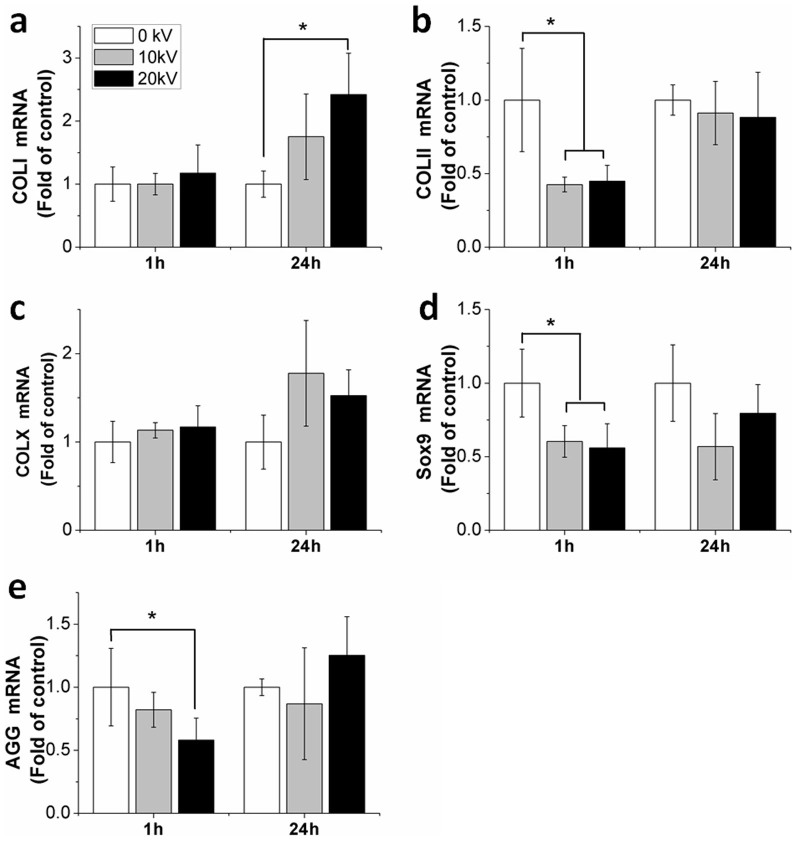
Figure 3. Functional gene expression of chondrocytes after nsPEF treatment.
Gene expression was analyzed at 1 hour for immediate effects and following a recovery period of 24 hours after 10 kV/cm and 20 kV/cm nsPEF treatment, respectively. (a) COL I; (b) COL II; (c) COL X; (d) Sox9; (e) AGG. Quantitative real-time PCR analysis was performed (n = 3). Untreated chondrocytes (0 kV) served as controls. Data expressed as mean ± s.d. * = p < 0.05.

