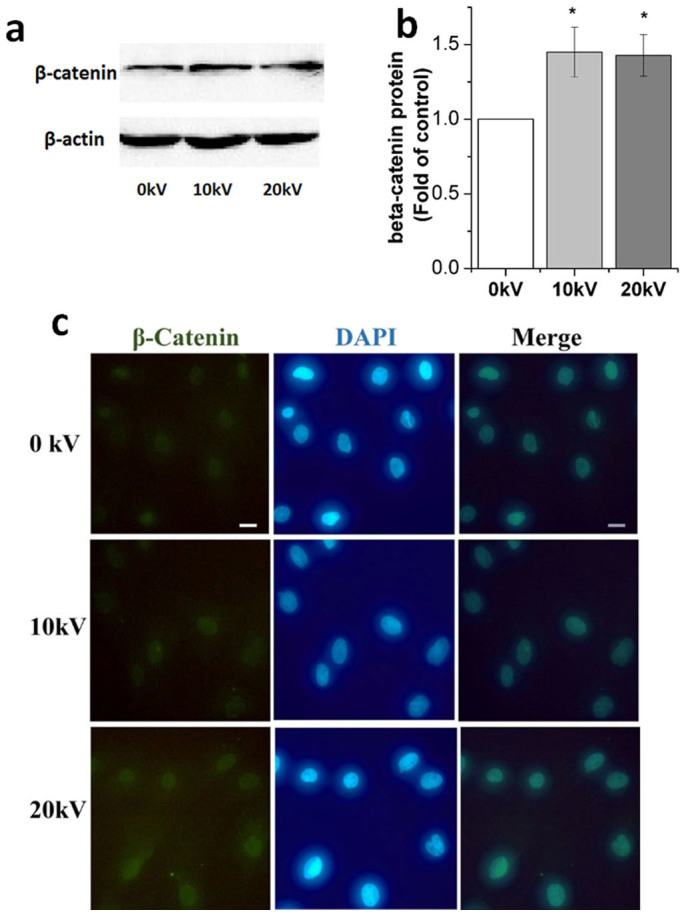
Figure 4. Activated wnt/β-catenin signaling pathway after nsPEF treatment.

(a) β-catenin protein expression performed with western blotting analysis using specific antibodies for β-catenin at 1 hour after 0, 10 and 20 kV/cm nsPEF treatment. (b) Histogram of quantitative analysis of relative β-catenin expression. (c) Immunofluorescence images of chondrocytes after 0, 10 and 20 kV/cm nsPEF treatment. The β-catenin is labeled with specific antibodies (green). Nucleus is stained with DAPI (blue). Scale bar represents 10 μm. Data expressed as mean ± s.d. * = p < 0.05.
