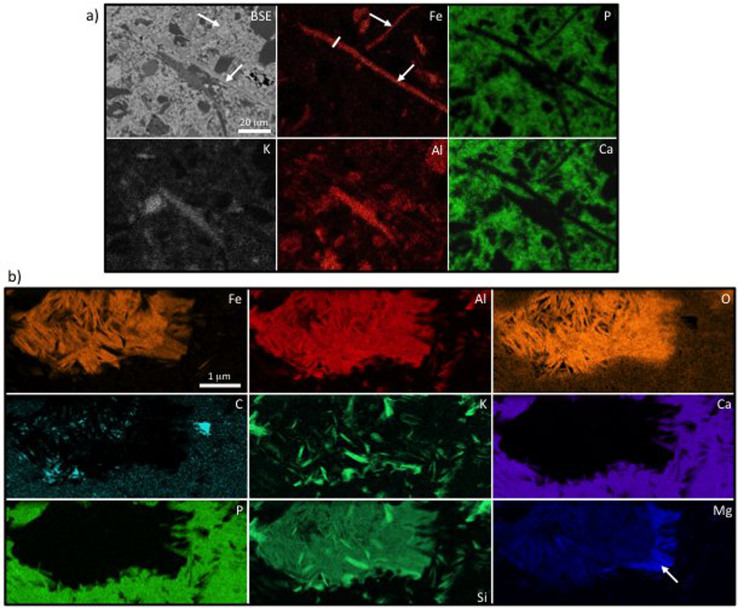
Figure 4. Mineral zonation in the vicinity of non-septate filaments from the Diabaig Formation.
(a) Backscattered electron image and SEM-EDS maps from a Diabaig phosphatic layer containing at least two non-septate filaments (arrows). Note the enrichment of iron in the filaments, plus the matrix dominated by calcium phosphate. The white line in the iron map indicates the approximate position of the TEM wafer mapped in (b). (b) ChemiSTEM elemental maps of a cross section through a Diabaig filament. Note that Fe-silicates replicate the approximate morphology of the filament and there are elevated carbon concentrations in part of this region. The increase in Mg:Fe ratio in the clay mineral (arrowed zone in Mg map) may represent the transition from filament interior to exterior.

