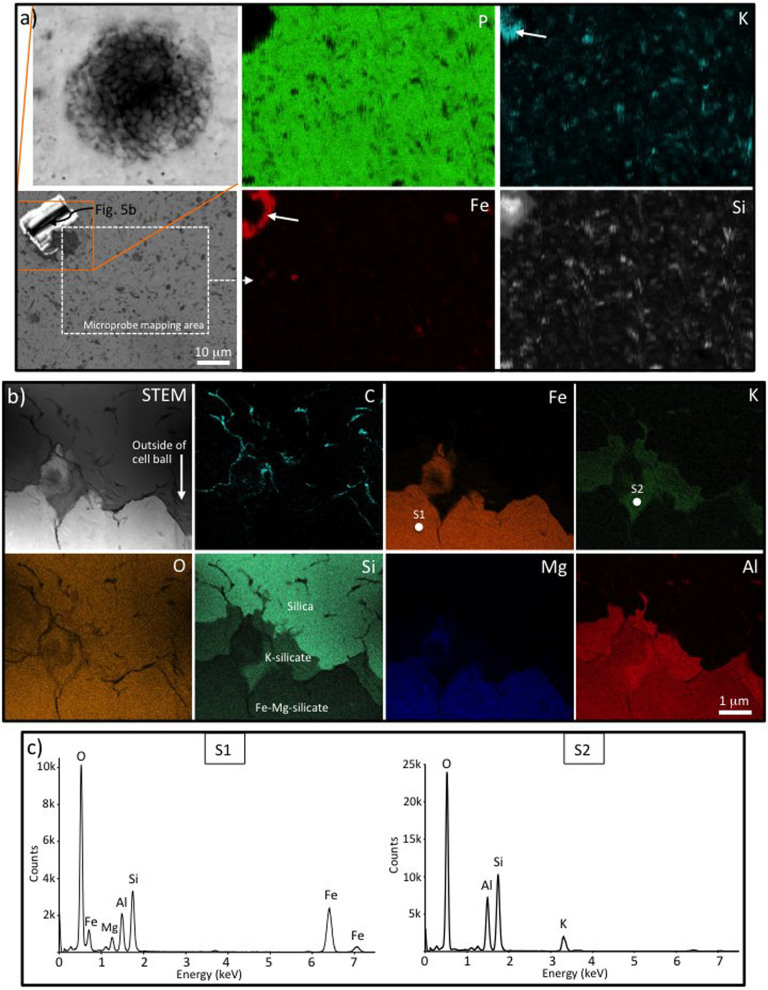
Figure 5. Distribution of minerals fossilizing a complex ball of cells from the Diabaig Formation.
(a) Microprobe EDS elemental maps encompassing approximately one quarter of the ball of cells (top left of the elemental maps), plus a large area of phosphate nodule matrix. Note the significant enrichment and restriction of Fe to the outer zone of the microfossil (arrow in Fe map). K-rich silicates are also found more centrally in the microfossil (arrow in K map) but also occur as small grains within the phosphate nodule matrix. The light micrograph (top left image) shows the morphology of the ball of cells prior to the in situ analyses, while the SEM image (bottom left) shows the ball of cells after extraction of the FIB wafer used in (b) (bright area in top left of image) plus the region element mapped (dashed box). (b) STEM image and ChemiSTEM elemental maps of part of the same ball of cells (from the FIB milled wafer extracted from the area indicated in (a)). These show a clear outer zone of Fe-rich (plus minor Mg) silicate, then a narrow zone of K-rich silicate, and central zone of silica (all labeled on green Si map). The mineralogy changes across distinct cell wall boundaries (highlighted in the pale blue C map). (c) STEM-EDS spectra of the Fe-rich clay (S1) and K-rich clay (S2) phases infilling the microfossil. The positions of these spectra are marked in the Fe and K maps respectively.

