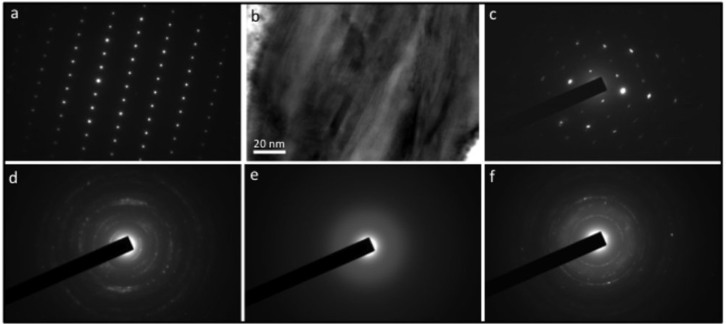
Figure 7. Mineral identification.
(a) Single crystal selected area electron diffraction (SAED) pattern from the calcium phosphate phase located just outside the microfossil in Figure 3; this spot patterncf.45, plus the presence of F and C in the EDS spectrum (Fig. 3b) is indicative of francolite, the typical calcium phosphate mineral in sedimentary phosphorites. (b) High resolution TEM image of the Fe-rich silicate mineral associated with the outer wall of the microfossil illustrated in Figure 3. This shows (as series of parallel lines) the ~1.4 nm interlayer spacing of a 2:1 ordered clay mineral of the chlorite group, and is consistent with the Fe-rich clay mineral chamosite45. (c) SAED pattern of the same mineral; the spot pattern is also consistent with chamosite45. (d) Selected area electron diffraction pattern from the Fe-rich silicate mineral infilling part of the microfossil in Figure 5; d-spacings obtained from the ring pattern show close matches to both the Fe-rich clay minerals berthierine and chamosite. It is not possible to distinguish these for certain because of the inherent accuracy of the electron diffraction technique. However, the d-spacing at ~0.265 nm, when present, consistently shows a closer fit to berthierine (0.267 nm) than chamosite (0.260 nm) (http://www.mindat.org). (e) SAED pattern from the K-rich silicate associated with the inner wall of the microfossil in Figure 3; the absence of spots or narrow rings in the pattern indicates that the mineral is amorphous in this area. (f) SAED pattern from part of the K-rich silicate towards the centre of the microfossil interior in Figure 3; the ring pattern is consistent with the K-rich clay illite45.

