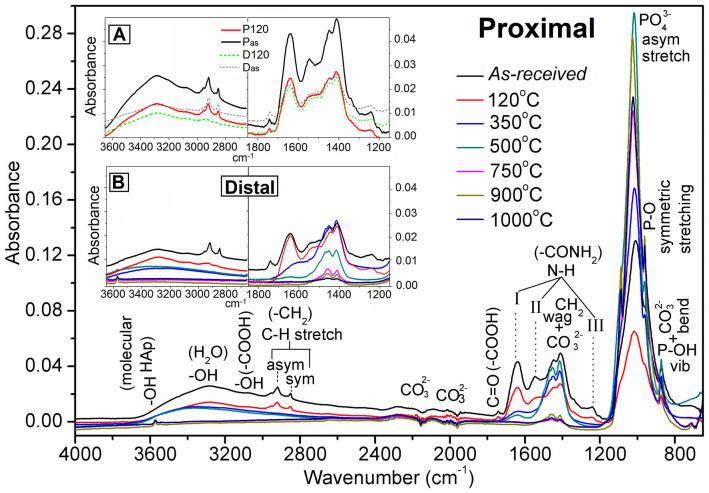
Figure 5. FTIR spectra of FBCBs at the proximal end before (Black – as-received) and after heat-treatments at 120°C (Red), 350°C (Blue), 500°C (Dark cyan), 750°C (Magenta), 900°C (Dark yellow) and 1000°C (Navy blue).
Inset-A: A precise comparison between the two selected specimens from proximal and distal parts – as-received (Black firm and Gray dot lines, respectively) and heat-treated at 120°C (Red firm and Green dot lines, respectively) samples at same absorbance scale; both asymmetric and symmetric C-H stretching peaks are still much higher with the heat-treatment at 120°C for P120 than that of D120. Inset-B: A comparison of an enlarged view of all the specimens from distal part at same intensity scale for two important regions (1850 to 1150 cm−1 and 3650 to 2650 cm−1).

