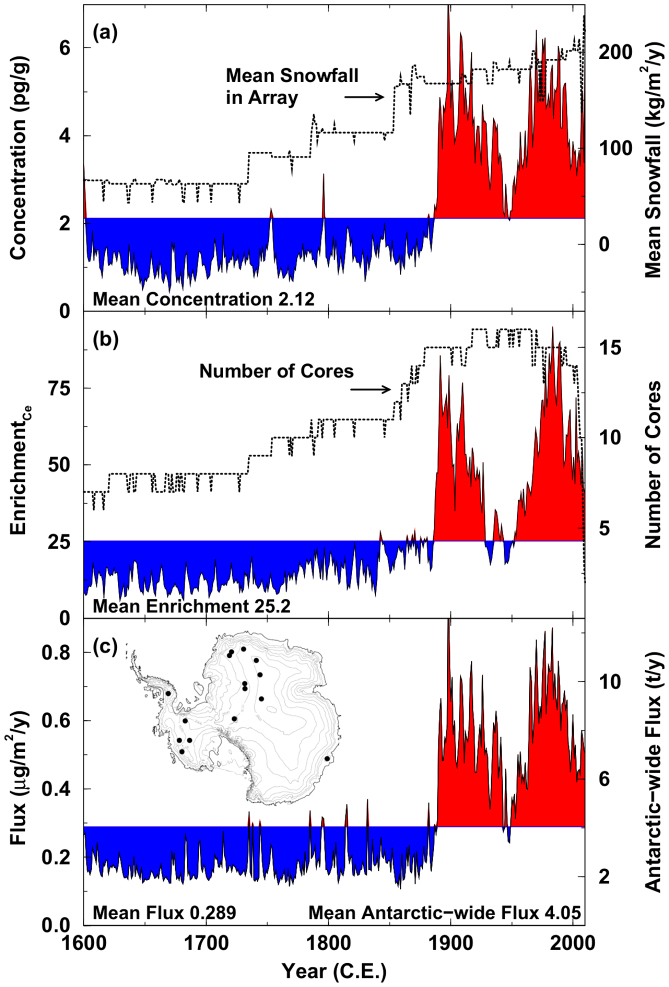
Figure 1. Composite ice core records of lead in Antarctica from 1600 to 2010 C.E. Records are in annual resolution.
Areas shaded in blue and red indicate time periods where the lead value is below or above the 1600 to 2010 mean, respectively, highlighting the marked changes before and after industrialization in the mid- and low-latitudes. (a) Lead concentration and the mean snowfall each year for the composite record. (b) Enrichment of lead relative to the dust proxy cerium28 and number of cores included in the composites each year. (c) Lead flux measured in the array after adjustment to account for site-specific differences in annual snowfall (left axis) and estimated Antarctic-wide flux (right axis). Integration of the red area indicates that ~610 t of industrial lead have been deposited in Antarctica during the past 130 years. Inset map shows the locations of the ice cores used in this study. Inset map was generated using Panoply Data Viewer software; Schmunk, Robert B. (2014). Panoply Data Viewer (version 4.0.1) [Software]. Available from http://www.giss.nasa.gov/tools/panoply/.

