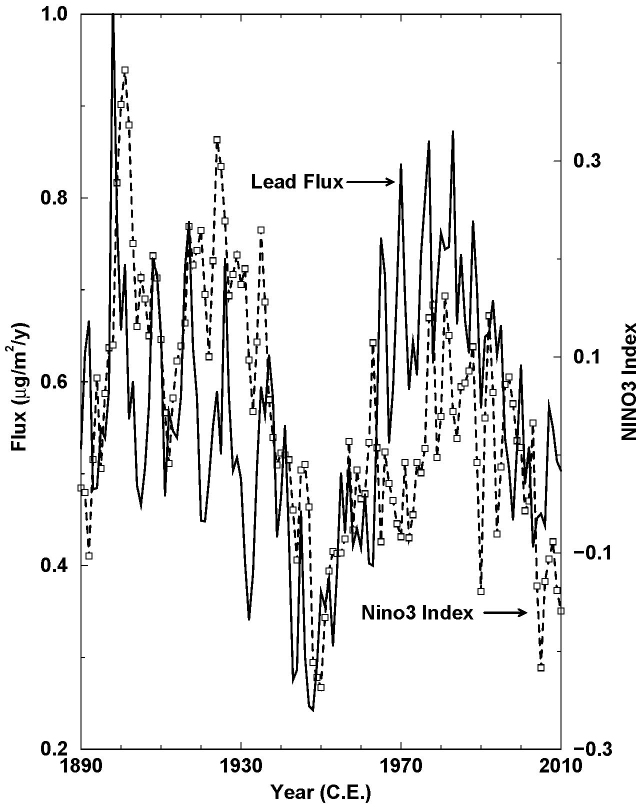
Figure 3. Comparison between 21-year running means of the composite lead flux from the eight ice cores individually dated using annual layer counting; Supplementary Fig. 8a) and a reconstruction of the ENSO Index (NINO3).
Similarities between multi-decadal ENSO variability and lead flux during the industrial era (post-1890) indicate that changes in long-range transport in addition to emissions may contribute to the observed variations in lead deposition over Antarctica.

