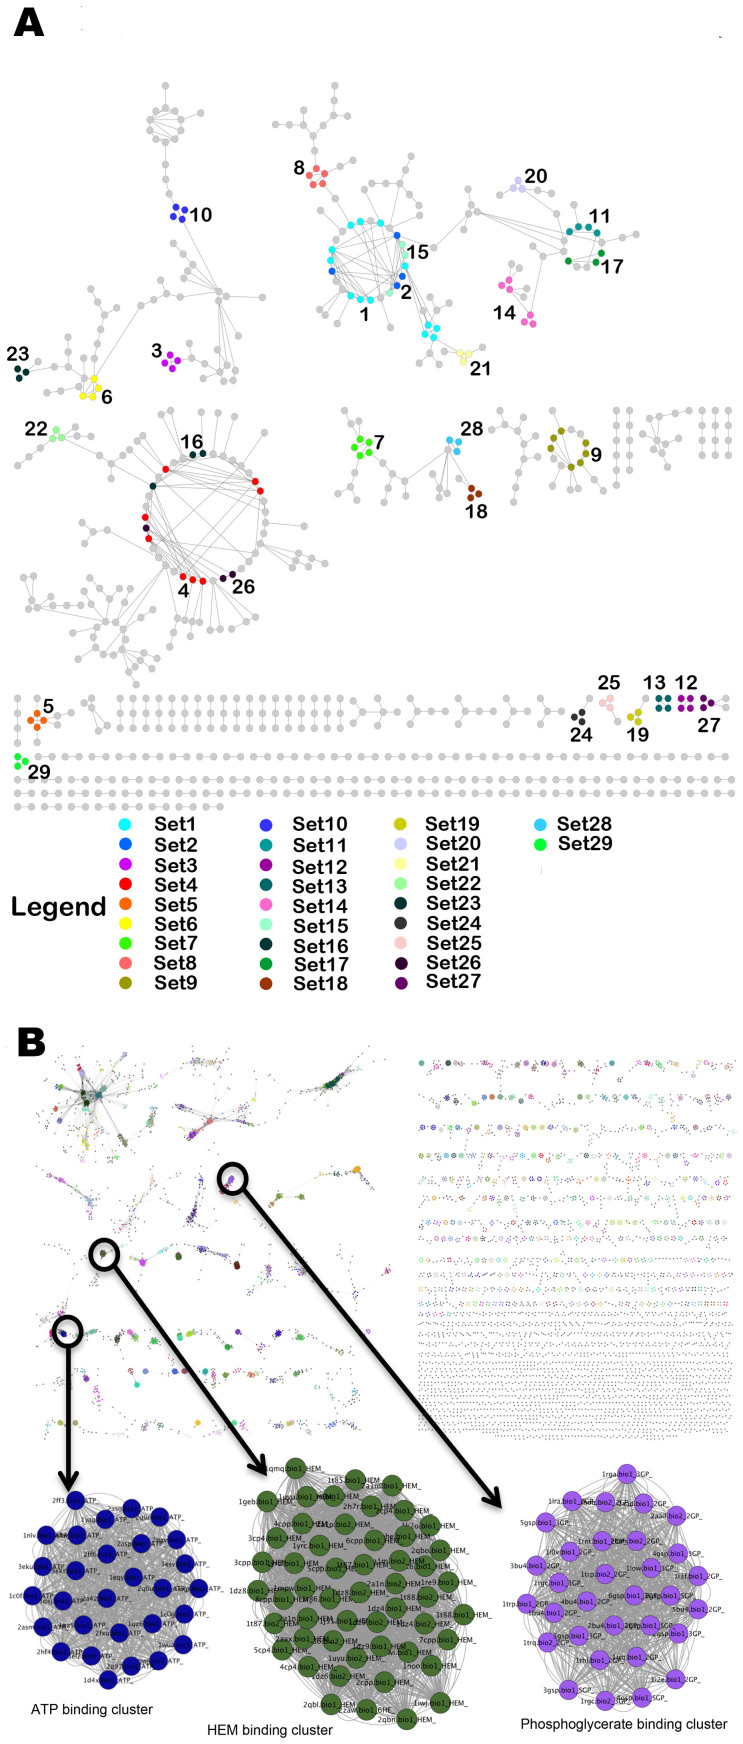
Figure 3. Binding Site Similarity networks.
(A) The binding site similarity network obtained for Mtb Pocketome. Each node represents the predicted binding site and an edge between two nodes represents high similarity shared (PMAX ≥ 0.7) between them. The colors represent different clusters or sets of binding sites predicted by MCODE algorithm. (B) Binding site similarity network of pockets obtained from MOAD dataset, carried out as a validation exercise. The color of the nodes again depicts set of similar binding sites obtained from MCODE algorithm. Three such example clusters binding to ATP, heme and phosphoglycerate respectively are shown in enlarged version.

