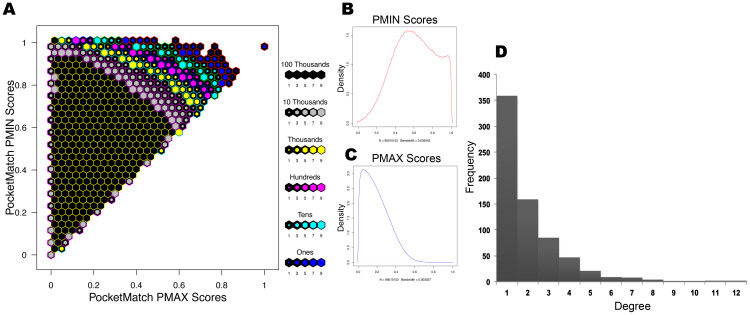
Figure 4.
An overview of all-pair binding site similarities in Mtb Pocketome representing the results of 96 million comparisons (A) Hexbin plot depicts the distribution of all-pair similarity scores obtained using PocketMatch. The y-axis depicts the local or partial binding site similarity scores (PMIN) and the x-axis depicts the global-similarity scores (PMAX). The color of the hexbin represents the density of the scores obtained and is shown in the legend next to the plot. (B) Distribution of all-pair PMIN scores. (C) Distribution of all-pair PMAX scores. (D) Degree distribution of the sites in Mtb binding site similarity network, indirectly capturing number of similar sites.

