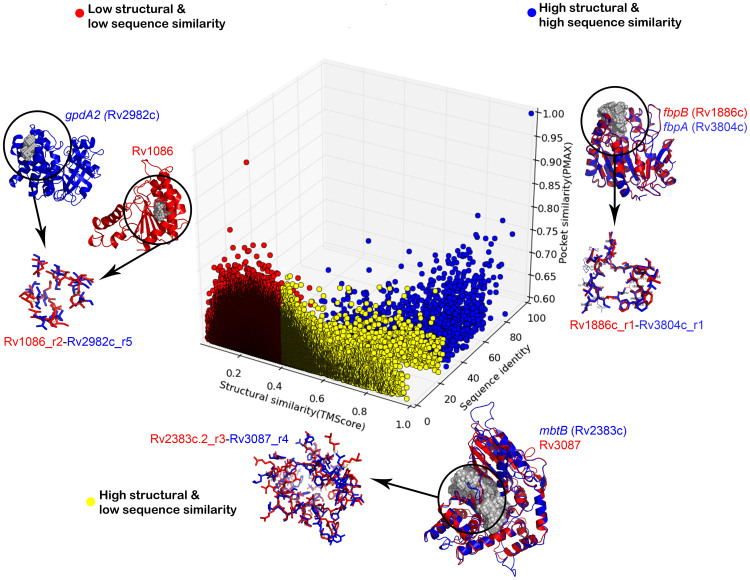
Figure 5. An illustration of the structure-sequence-pocket space relationships in Mtb proteome.
The 3D scatterplot depicts the distribution of high similarity pockets with respect to sequence and structural similarity scores obtained for the corresponding proteins. The color represents different categories of sequence-structure relationship and an example is highlighted from each of these categories with the depiction of proteins and pockets similarity.

