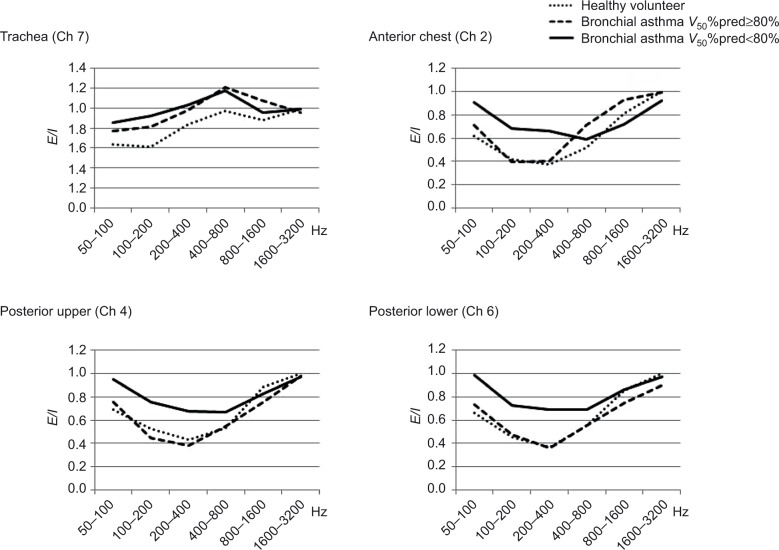
Figure 2.
E/I values in each frequency band in asthmatic subjects and healthy volunteers.
Notes: The vertical axis represents E/I values, and the horizontal axis denotes frequency bands (in hertz). The medians of E/I in individual frequency bands are plotted separately for patients with V50%pred <80%, asthmatic subjects with V50%pred ≥80%, and healthy volunteers.
Abbreviations: E/I, expiration-to-inspiration sound pressure ratio; %pred, %predicted; Ch, channel.

