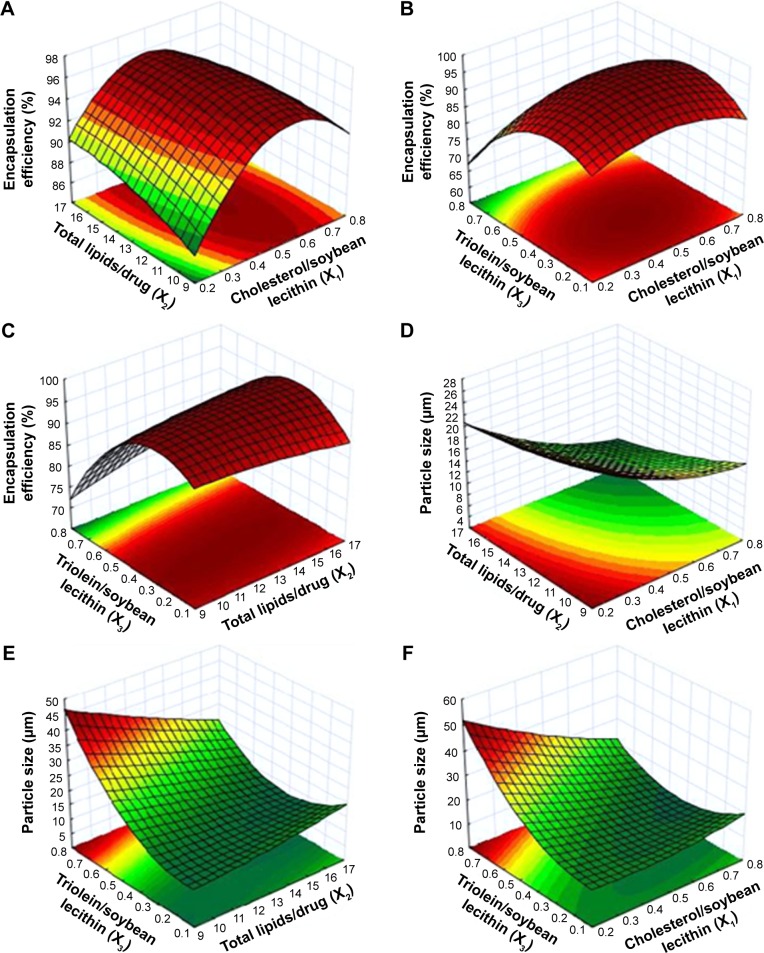
Figure 2.
Response surface plot and contour map of the combined effect of (A, D) X1 and X2, (B, F) X1 and X3, and (C, E) X2 and X3 on the encapsulation efficiency (%) and the particle size (µm).
Notes: X1, weight ratio of cholesterol/soybean lecithin; X2, weight ratio of total lipids/drug; X3, weight ratio of triolein/soybean lecithin.

