Figure 4.
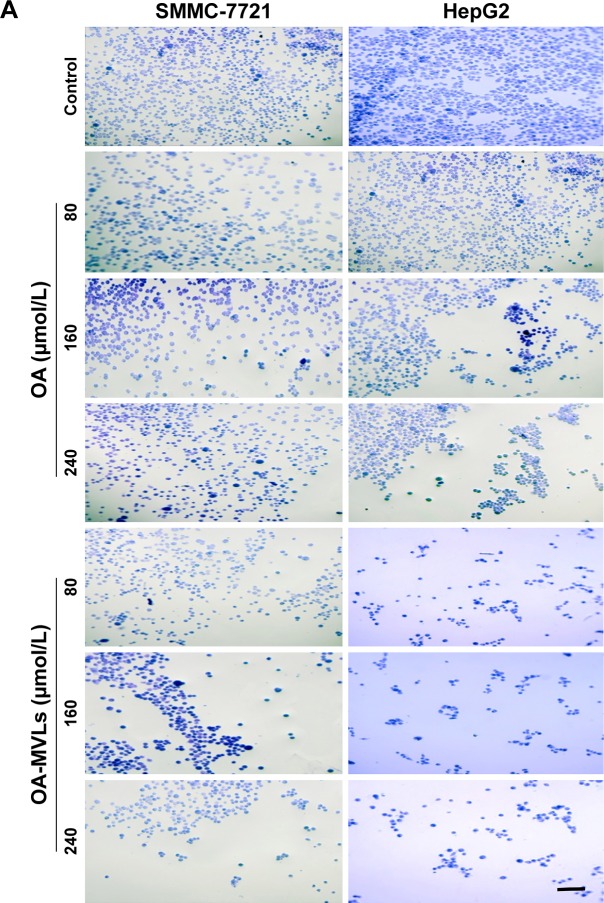
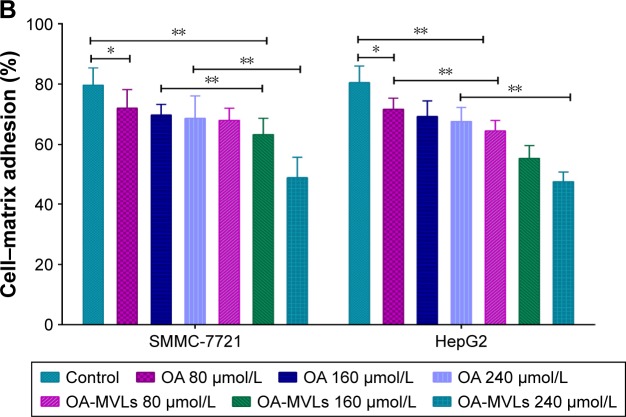
Results of cell–matrix adhesion assays on both SMMC-7721 and HepG2 cells in vitro.
Notes: (A) Representative images of SMMC-7721 and HepG2 cells adhered with the Matrigel matrix after treatment with various concentrations of OA and OA-MVLs; (B) quantitative analysis of adhesion rate of HepG2 and SMMC-7721 cells detected by MTT assays. Independent experiments were measured in triplicate and repeated at least three times for each cell type. Results are presented as mean ± SD with *P<0.05, **P<0.01, scale bar 20 µm and magnification (200×).
Abbreviations: OA, oleanolic acid; MVLs, multivesicular liposomes; MTT, 3-(4,5 dimethylthiazol-2-yl)-2,5-diphenyl-tetrazolium bromide; SD, standard deviation.


