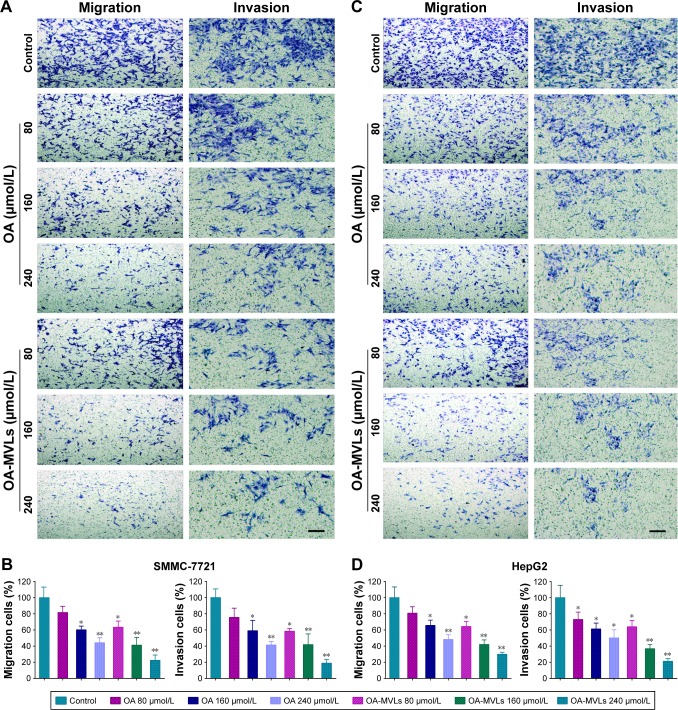
Figure 6.
Results from cell migration and invasion assays conducted in transwell chambers.
Notes: After separate treatment with different concentrations of OA and OA-MVLs, the migrated and invaded (A) SMMC-7721 cells and (C) HepG2 cells stained by crystal violet dye were observed under the light field of microscope. For quantitative analysis, the percent rates of migration and invasion of (B) SMMC-7721 cells and (D) HepG2 cells were calculated as: (Cells Numbertreatment group/Cells Numbercontrol group) ×100%. At least three chambers from three different experiments were analyzed statistically. Data were shown as mean ± SD with *P<0.05 and **P<0.01 compared with the control group, magnification (200×) and scale bar (20 µm).
Abbreviations: OA, oleanolic acid; MVLs, multivesicular liposomes; SD, standard deviation.

