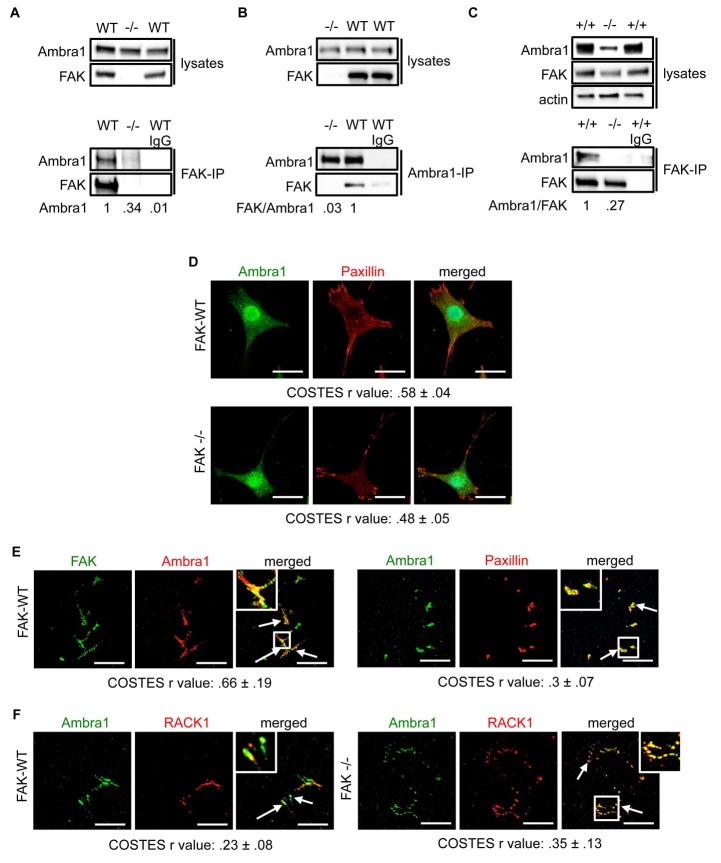
Figure 1. Ambra1 interacts with FAK at focal adhesions.
FAK or Ambra1 were immunoprecipitated from FAK-WT and FAK -/- cell lysates using (A) anti-FAK 4.47 agarose or (B) anti-Ambra1, followed by western blot analysis with anti-FAK and anti-Ambra1. (C) FAK was immunoprecipitated from Ambra1 +/+ and Ambra1 -/- MEF cell lysates using anti-FAK 4.47 agarose, followed by western blot analysis with anti-FAK and anti-Ambra1. Anti-β-actin was used as a loading control. Relative ratios of Ambra1, FAK/Ambra1 and Ambra1/FAK interactions were calculated by densitometry. (D) FAK-WT and FAK -/- cells were seeded onto glass coverslips, fixed and stained using anti-Ambra1 and anti-Paxillin. Scale bars, 20 μm. (E, F) Focal adhesions were isolated from FAK-WT and FAK -/- cells using hydrodynamic force. (E) Focal adhesions (solid arrows) were stained with anti-FAK and anti-Ambra1 (left panels) and with anti-Ambra1 and anti-Paxillin (right panels). (F) Focal adhesions (solid arrows) were stained with anti-Ambra1 and anti-Rack1 in SCC FAK-WT (left panels) and SCC FAK -/- cells (right panels). Scale bars, 20 μm. Colocalisation (Costes r value from five cells) was analysed using the ImageJ plugin JaCoP (Bolte and Cordelières, 2006).
DOI: http://dx.doi.org/10.7554/eLife.23172.003


