. 2017 Mar 31;6:e23172. doi: 10.7554/eLife.23172

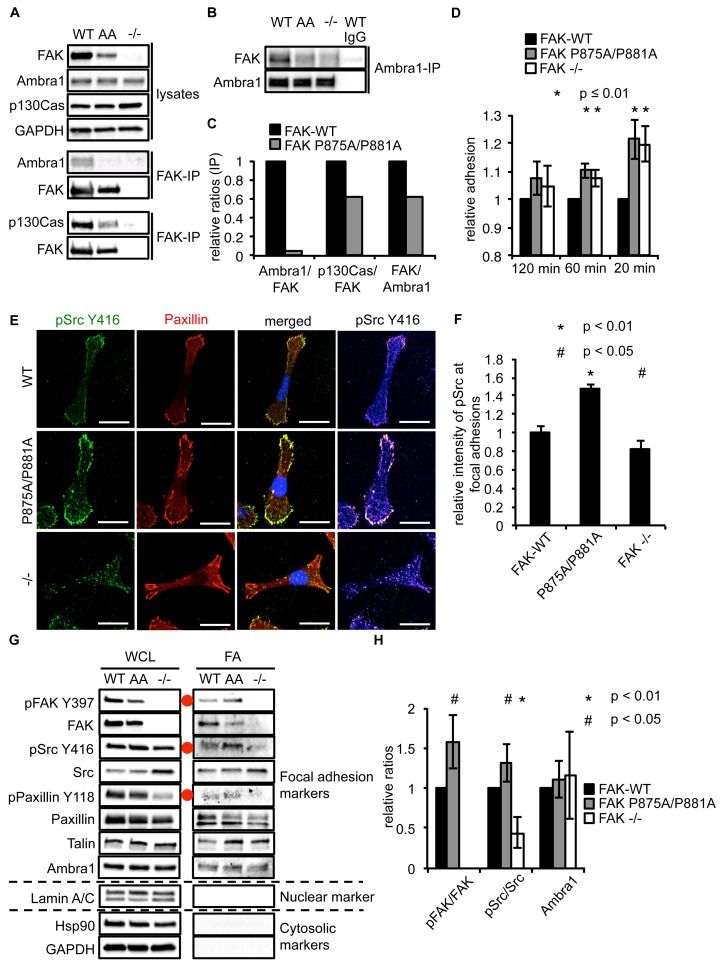
Figure 5. Ambra1 binding impaired FAK increases cell adhesion and pSrc at focal adhesions.

(A, B) FAK (A) or Ambra1 (B) were immunoprecipitated from FAK-WT, FAK P875A/P881A (AA) and FAK -/- cell lysates using anti-FAK 4.47 agarose or anti-Ambra1, followed by western blot analysis with anti-FAK, anti-Ambra1 and anti-p130Cas. Anti-GAPDH was used as a loading control. (C) Relative ratios of Ambra1/FAK and p130Cas/FAK interactions were calculated by densitometry. (D) Adhesion assay: SCC FAK-WT, FAK P875A/P881A and FAK -/- cells were plated in serum-free conditions on fibronectin-coated plates. Samples were normalised to the 6 hr time point and relative adhesion was calculated by setting the FAK-WT values to 1. n = 3. Error bars, s.d. p≤0.01. (E, F) SCC FAK-WT, FAK P875A/P881A and FAK -/- cells were grown on glass coverslips for 24 hr, fixed and stained with anti-pSrc Y416, anti-Paxillin and DAPI. Scale bars, 20 μm. The relative intensity of pSrc staining at focal adhesions from five cells (at least 10 focal adhesions/cell) was measured using ImageJ. (E) Representative immunofluorescence images are shown. (F) Quantification of the relative pSrc intensity at focal adhesions. n = 5. Error bars, s.e.m. p<0.01 (*) and p<0.05 (#). (G) Focal adhesions from SCC FAK-WT, FAK P875A/P881A (AA) and FAK -/- cells were crosslinked and isolated for western blot analysis with the indicated antibodies. Paxillin and Talin served as markers for focal adhesions and Lamin A/C was used as a nuclear marker. Hsp90 and GAPDH represented cytosolic markers. WCL, whole cell lysate; FA, focal adhesions. The purity of the isolated focal adhesions was determined by the absence of nuclear proteins like Lamin A/C and cytosolic markers like Hsp90 and GAPDH. There was less active Src at focal adhesions in the FAK-deficient SCC cells due to Src’s internalisation to autophagic structures. Additionally, increased pPaxillin Y118 and Talin levels could be detected in the FAK Ambra1-binding mutant compared to SCC FAK-WT and FAK -/- cells. No changes in Ambra1 levels at focal adhesions could be detected. (H) The relative ratios of pFAK/FAK, pSrc/Src and Ambra1 at focal adhesions were calculated using densitometry. n = 3. Error bars, s.d. p<0.01 (*) and p<0.05 (#).

DOI: http://dx.doi.org/10.7554/eLife.23172.015

Figure 5—source data 1. Relative mean values of adhesion, pSrc intensity at focal adhesions and relative ratios at focal adhesions.
Mean and s.d. values of relative adhesion on fibronectin of SCC FAK-WT, P875A/P881A and -/- cells are shown (Figure 5D). The relative mean intensity and s.e.m. of pSrc at focal adhesions are shown (Figure 5F). Relative ratios (mean and s.d.) of pFAK/FAK, pSrc/Src and Ambra1 of isolated focal adhesions are shown (Figure 5H).
DOI: 10.7554/eLife.23172.016

Figure 5.

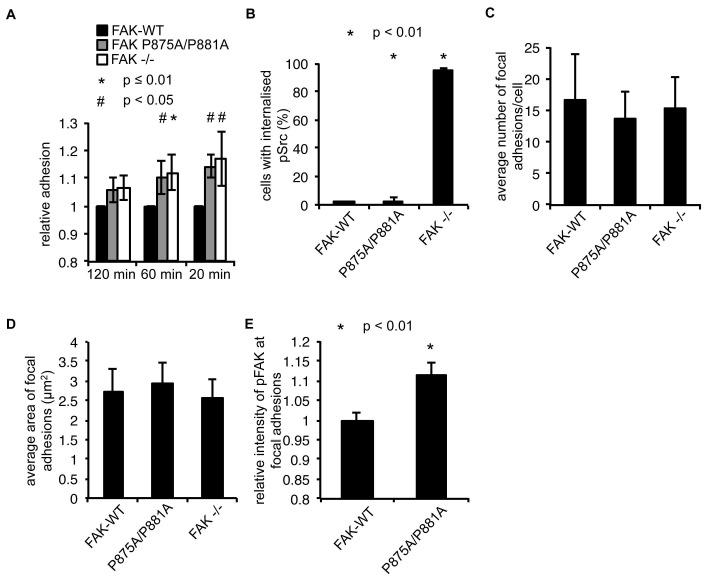
Figure 5—figure supplement 1. FAK Ambra1-binding mutant promotes adhesion and invasion.

Figure 5—figure supplement 1.

(A) Adhesion assay: SCC FAK-WT, FAK P875A/P881A and FAK -/- cells were plated in serum-free conditions on uncoated plates (plastic). Samples were normalised to the 6 hr time point and relative adhesion was calculated by setting the FAK-WT values to 1. n = 3. Errors bars, s.d. p≤0.01 (*) and p<0.05 (#). (B) Quantification of internalised active Src. n = 3. Error bars, s.d. p<0.001. (C) The average number of focal adhesions per cell was counted. n = 3. Error bars, s.d. (D) The average size of focal adhesions was measured using ImageJ. n = 3. Error bars, s.d. (E) The relative intensity of pFAK Y397 staining at focal adhesions from five cells (at least 10 focal adhesions/cell) was measured using ImageJ. n = 3. Error bars, s.e.m. p<0.01.
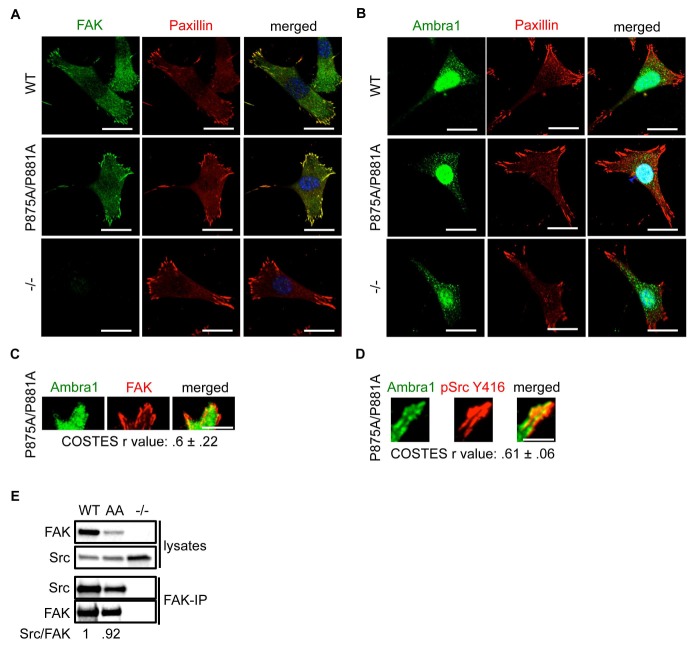
Figure 5—figure supplement 2. FAK Ambra1-binding mutant promotes adhesion and invasion.

Figure 5—figure supplement 2.

(A, B) SCC FAK-WT, FAK P875A/P881A (AA) and FAK -/- cells were grown on glass coverslips, fixed and stained with anti-FAK, anti-Paxillin and DAPI (A) and anti-Ambra1, anti-Paxillin and DAPI (B), respectively. Scale bars, 20 μm. There were no visible differences between total FAK or Ambra1 intensity staining. (C, D) Total Internal Reflection Fluorescence (TIRF) microscopy of SCC FAK P875A/P881A cells stained with anti-Ambra1 and anti-FAK (C) or anti-Ambra1 and anti-pSrc Y416 (D). Colocalisation (COSTES r value of five cells) was analysed using the ImageJ plugin JaCoP. Scale bars, 10 μm. (E) FAK was immunoprecipitated from FAK-WT, FAK P875A/P881A (AA) and FAK -/- cell lysates using anti-FAK 4.47 agarose, followed by western blot analysis with anti-FAK and anti-Src. The relative ratio of Src/FAK interaction was calculated by densitometry.