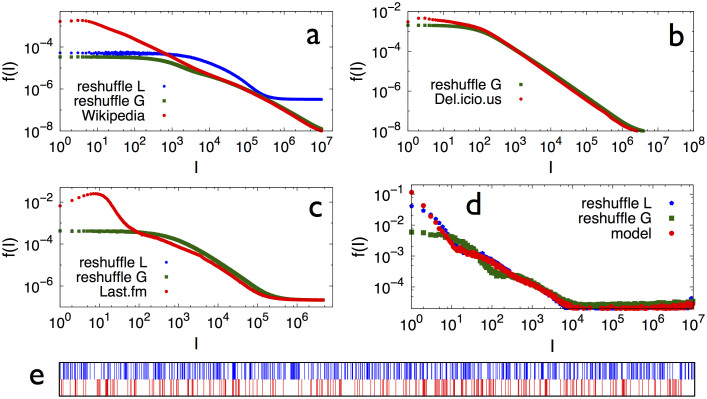
Figure 3. Distribution of triggering intervals in real data and in the urn model with semantic triggering.
Results for the distribution of triggering intervals (see the section Methods for the definition) for the same data as for the entropy measurements in figure 2: Wikipedia (a), the Delicious dataset (here the calculation of the local reshuffling was too time-consuming due to the fact that there are as many labels as words), (b), the Last.fm dataset (c) and the urn model with semantic triggering (d). The banner at the bottom(e) shows a  sequence for a particular label A of the Last.fm dataset. The color code is red for the actual sequence
  and blue for the local reshuffle (see methods section) of
  .
.

