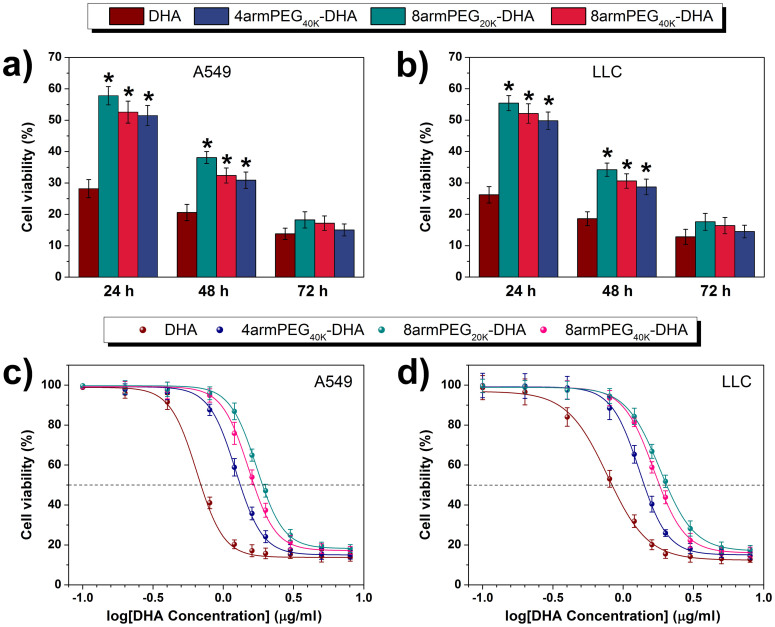
Figure 4.
Cell viability of A549 (a) and LLC (b) cells treated with 8 μg/ml of DHA and PEG-DHA (equivalent to free BA) was measured by CCK-8 assay (n = 3, error bars represent standard deviation). CCK-8 assay of DHA and PEG-DHA conjugates with different concentration in A549 (c) and LLC (d) cell lines (n = 3, error bars represent standard deviation).

