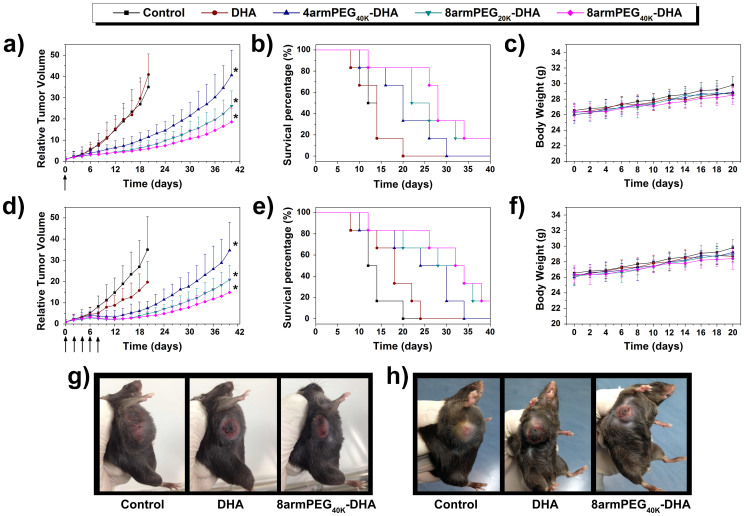
Figure 7. Antitumor efficacies of DHA and different DHA conjugates in the subcutaneous mouse model of LLC.
Tumor volumes of mice during treatment with either a single (a) or multiple (q2d × 5) injections (d). Survival of mice in different treatment with either a single (b) or multiple (q2d × 5) injections (e). Body weight after treatment with either a single (c) or multiple (q2d × 5) injections (f). Tumor images of different groups after treatment with either a single (g) or multiple (q2d × 5) injections (h) at day 20 (n = 6, error bars represent standard deviation).

