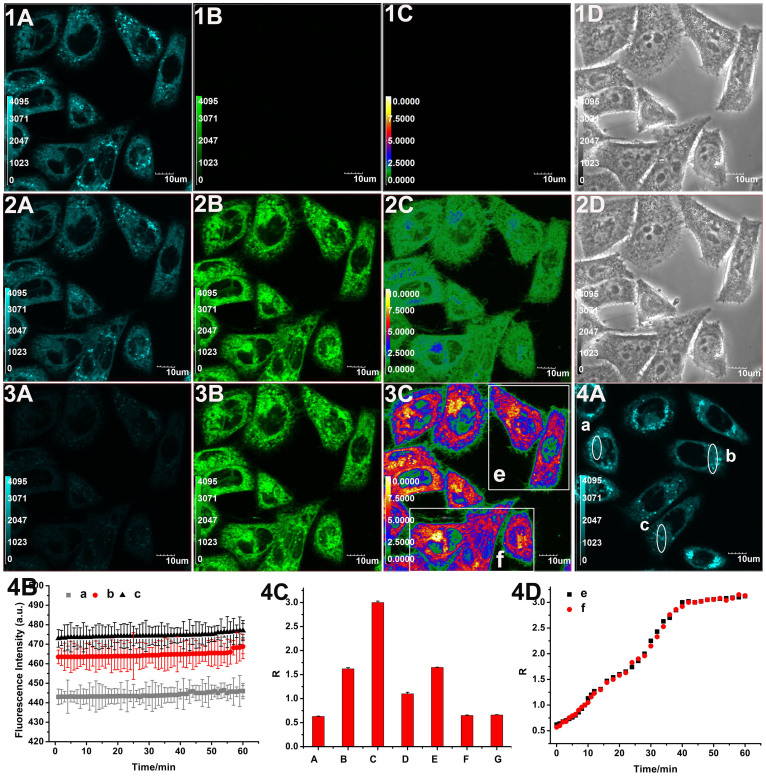
Figure 4. Confocal fluorescence imaging of exogenous sulphide in living MCF-7 cells using RHP-2.
Cells were incubated with RHP-2 (5 μM) for 30 min (1A, 1B, 1C and 1D). Cells in panels 1A, 1B, 1C and 1D were then treated with Na2S (300 μM) for 20 min (2A, 2B, 2C, and 2D) and 40 min (3A, 3B, 3C and 3D). Blue channel images were obtained from 445 nm to 495 nm (1A, 2A and 3A). Green channel images were obtained from 520 nm to 580 nm (1B, 2B and 3B). Ratiometric images (F520–580 nm/F445–495 nm) were generated by Olympus software (1C, 2C and 3C) and the corresponding bright images were shown in 1D and 2D. Cells were incubated with RHP-2 (5 μM) alone for 60 min (4A). The average fluorescence intensities were recorded at 60-s intervals in three designated sites (a, b and c) shown in panel 4A (4B) (mean ± SD, n = 3). The average fluorescence emission intensity ratios (R = F520–580 nm/F445–495 nm) according to the corresponding ratiometric images of cells (4C) (mean ± SD, n = 3). Temporal profiles of average emission intensity ratios (R) at two designated sites (e and f) in panel 3C (4D) (mean ± SD, n = 3). Scale bars = 10 μm.

