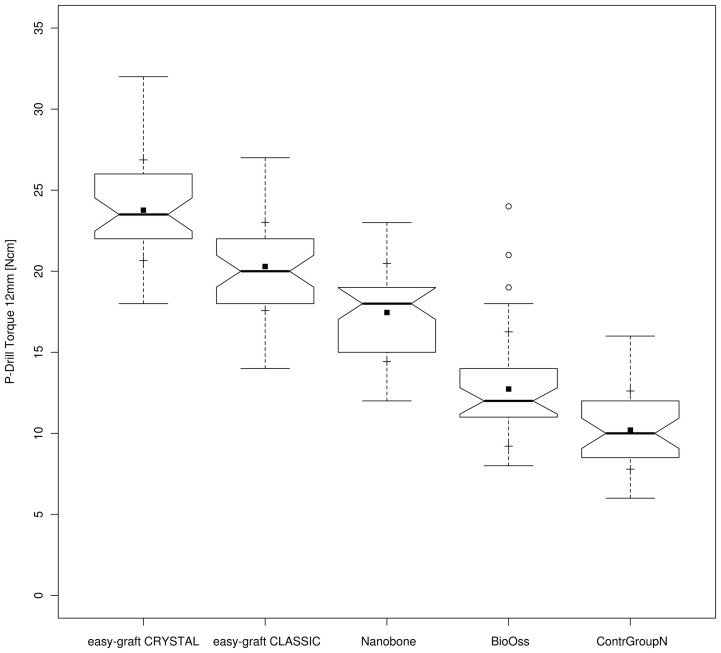
Figure 5. Drill-Torque notched box plot: depicts the interquartile range (IQR) between the 25th and 75th percentile of the specific biomaterial tested where 50% of the data points were located.
Additionally, the upper whiskers represent data within the 75th percentile +1.5 times the IQR. The lower whisker delimits data of the 25th percentile – 1.5 times the IQR. Circles [ ] represent the outliers. Within the boxes the notches mark the confidence interval based on the median +/− 1.58 (IQR/sqrt of n) [n = number of measurements]. Additionally, the mean value is indicated by a black square [
 ] and the cross symbol [+] displays the standard deviation. Bio-Oss (n = 34), NanoBone (n = 42), easy-graft CLASSIC (n = 41), easy-graft CRYSTAL (n = 38), Control Group (n = 36).

