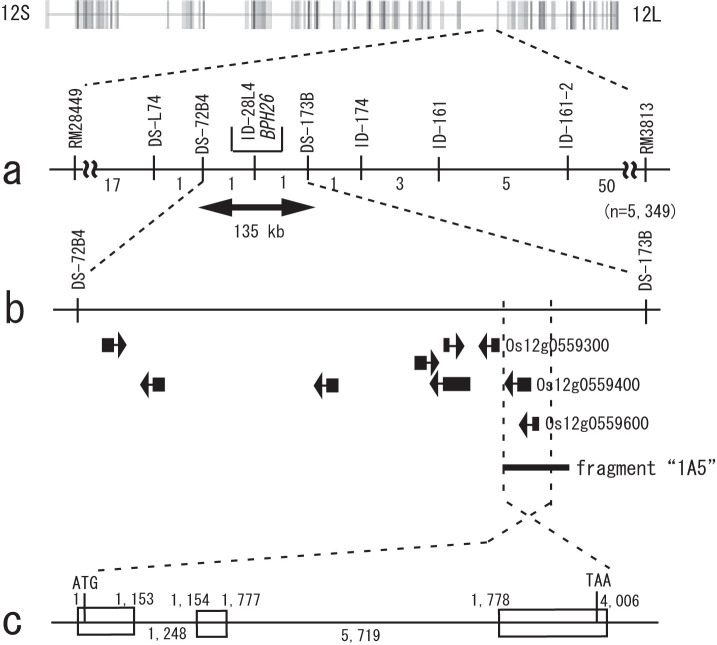
Figure 1. High-resolution genetic map of BPH26.
(a) Genetic linkage map of 5,349 BC6F3 plants showing the relative position of BPH26 with the single-sequence repeat, insertion-deletion, and single nucleotide polymorphism markers on chromosome 12. The numbers under the linkage map indicate the number of recombinants in the adjacent marker intervals. Framework maps are quoted from Harushima et al58. (b) Putative genes in the candidate region whose presence is predicted by the Rice Annotation Project Database. A fragment 1A5 shows the genomic DNA of ADR52 which was used for the functional complementation test. (c) The structure of BPH26 on the genomic DNA of ADR52.

