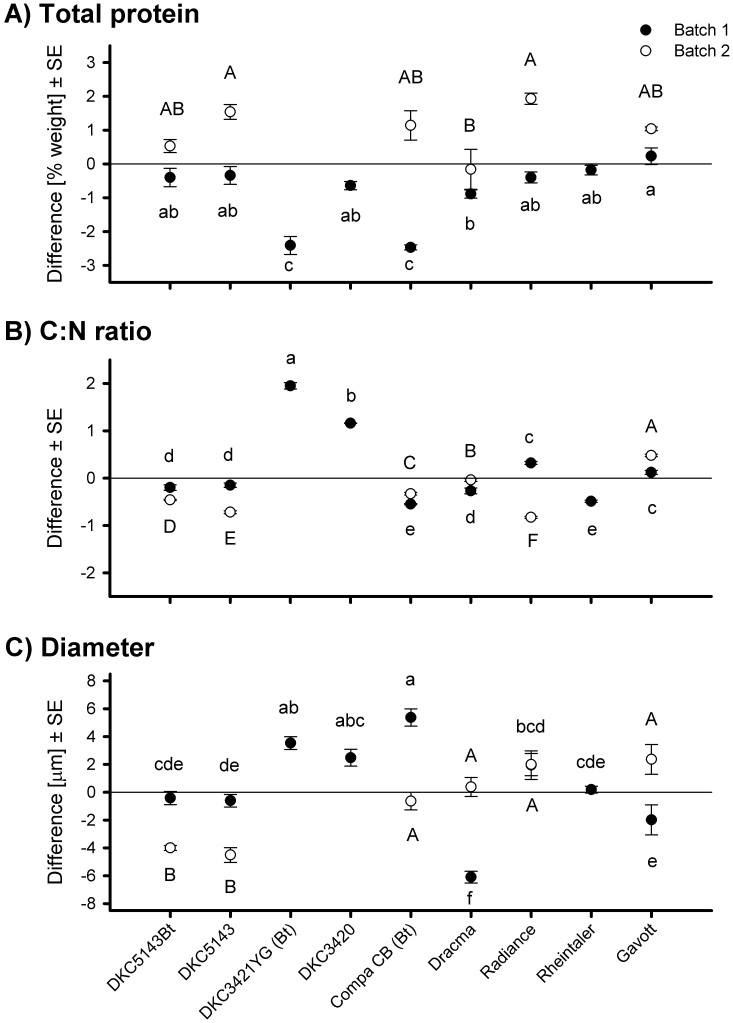
Figure 1. Relative total protein content (A), C:N ratio (B), and diameter (C) of pollen from nine maize cultivars grown in two batches, one after the other, in the same glasshouse.
Pollen was pooled for all plants per batch (3–10 flowering plants). Five subsamples were analyzed per cultivar and batch for each parameter. The difference between the mean of each cultivar and the total mean of all cultivars is plotted on the Y-axis. Statistical comparisons (ANOVA) were performed separately for each pollen batch. Batch 2 did not include all maize cultivars. Different lowercase and uppercase letters indicate significant differences for batch 1 and 2, respectively.

