
Figure 4. SEM-micrograph of the microstructure of an opaque sample annealed at 970°C for 20 h.
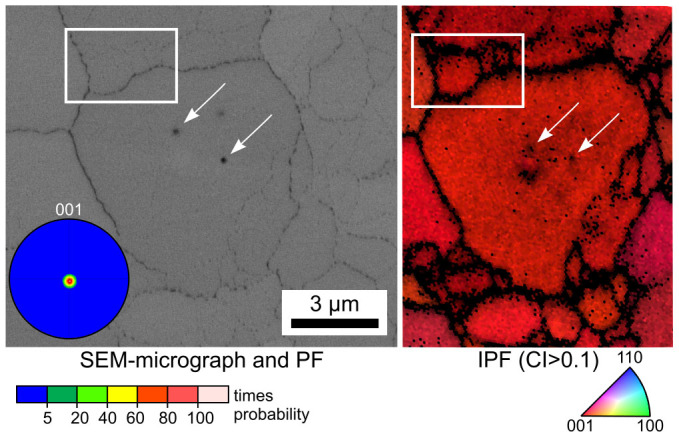
The IPF-map of a performed EBSD-scan is presented along with the 001-PF of a texture calculated from the scan.
Official websites use .gov
A
.gov website belongs to an official
government organization in the United States.
Secure .gov websites use HTTPS
A lock (
) or https:// means you've safely
connected to the .gov website. Share sensitive
information only on official, secure websites.
The IPF-map of a performed EBSD-scan is presented along with the 001-PF of a texture calculated from the scan.