
Figure 1.
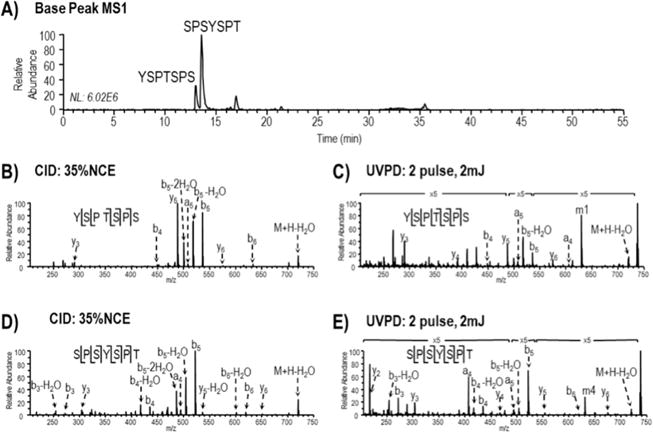
LC-MS base peak MS1 chromatogram and MS/MS spectra of unmodified yeast CTD heptads following digestion with trypsin and proteinase K. (A) LC-MS base peak MS1 chromatogram with peaks corresponding to the elution of unmodified heptad peptides (m/z 738) detected at time 13–14 min. (B and C) MS/MS (CID and UVPD) mass spectra acquired for protonated YSPTSPS. (D and E) MS/MS (CID and UVPD) mass spectra acquired for protonated SPSYSPT. Tyr side chain losses generated by UVPD are denoted m1 and m4 for YSPTSPS and SPSYSPT, respectively.