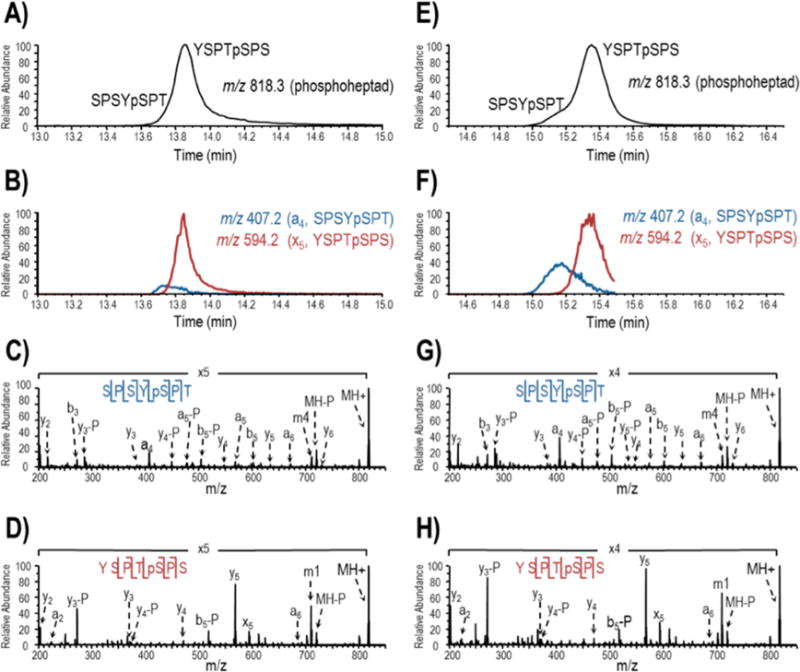
Figure 2.

LC-UVPD-MS analysis of TFIIH and Erk2 treated yeast GST-CTD digested with trypsin and proteinase K. The base peak MS1 chromatograms (0–45 min) are provide in Supplemental Figure 2. Two singly phosphorylated heptads, m/z 818.3, are partially resolved in the base peak MS1 chromatogram (A for TFIIH and E for Erk2). In subsequent LC-MS analysis, m/z 818.3 was targeted for activation during the course of elution and extracted ion chromatograms (XICs) for distinguishing product ions, a4 from protonated SPSYpSPT and x5 from protonated YSPTpSPS, were generated to track the isomeric peptides (B for TFIIH and F for Erk2). UVPD using two 2 mJ pulses was used to sequence the heptad peptides and localize the sites of phosphorylation (C and D for TFIIH; G and H for Erk2). Ions that have undergone phosphate neutral loss are denoted with “-P”. Tyr side chain losses generated by UVPD are denoted m1 and m4 for YSPTSPS and SPSYSPT, respectively.
