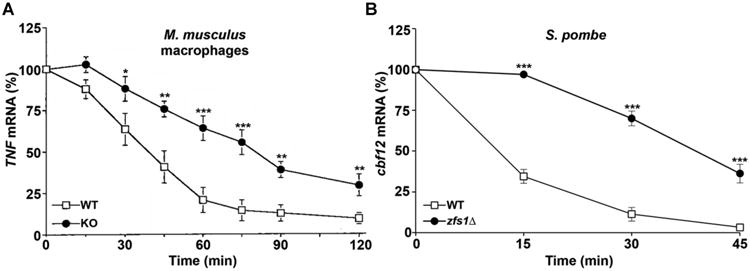
Figure 4. Decay of target transcripts in mouse macrophages and S. pombe cells.

In (A), TNF mRNA decay was measured in macrophages from wild-type and TTP-deficient mice, as described [6], and in (B), Cbf12 mRNA decay was measured in S. pombe wild-type and zfs1Δ cells, as described [65]. mRNA was measured at the indicated times following treatment with the transcriptional inhibitor actinomycin D (A) or thiamine (B). The amount of the target mRNA at time 0 was taken as 100% in each experiment. Results are expressed as the mean relative amount of mRNA ± SEM at each time point (*P < 0.05 when comparing the means by Student's t test; **P < 0.01; ***P < 0.001). Modified from [6, 65], with permission.
