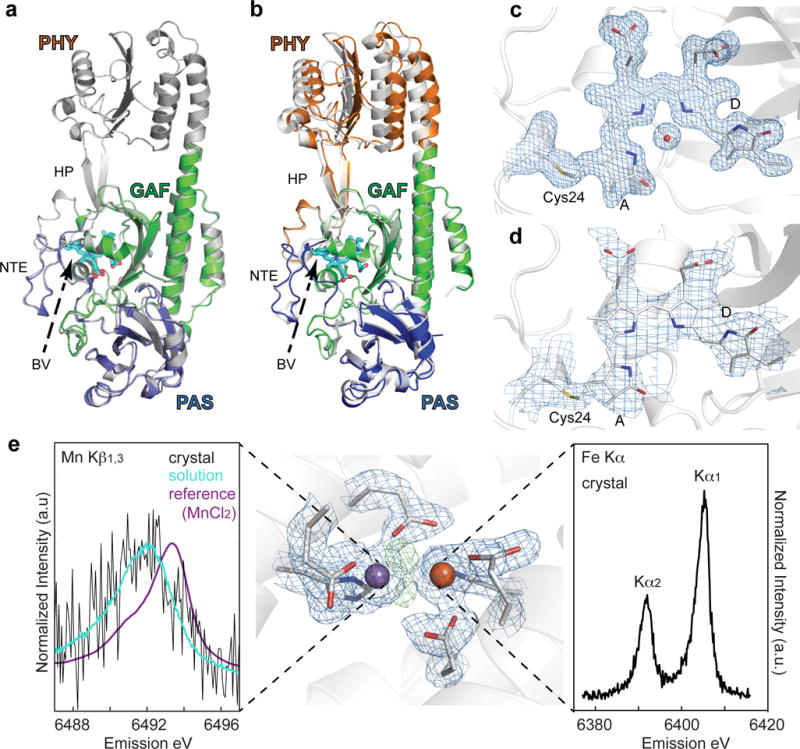
Figure 4. XRD of various enzymes.

a. The PAS-GAF (blue and green, respectively) and the PSM (white) constructs from D. radiodurans BphP in their dark-adapted Pr states are shown superimposed. b. Superposition of atomic models of the PSM in the room-temperature Pr state (colored) with that derived from diffraction data collected at 100 K (white, PDB ID 4Q0J). The β-sheets of the GAF domains were superposed, allowing the respective positions of the PAS and PHY domains of the two models to be identified. The largest differences between the models were found at the PHY domain. For the room temperature model the domains were colored blue, green, and orange for the PAS, GAF, and PHY domains, respectively. Several important features are labeled: HP, hairpin; NTE, amino-terminal extension; BV, biliverdin. BV from the room temperature structure is shown for orientation. c and d. Composite simulated-annealing omit maps (2Fo-Fc) contoured at 1 σ were superimposed with the corresponding PAS-GAF (c) or PSM (d) model of DrBphP22. For clarity only electron density around Cys24 (gray), biliverdin (cyan) and for (c) the pyrrole water is shown. e. Metal site electron density (2Fo-Fc) at the heterodinuclear Mn/Fe site in aerobic class Ic RNR, metal ions and protein ligands are indicated (contoured to 1.3 σ) in blue. Residual positive difference electron density map (Fo-Fc) representing non-protein ligands is indicated in green (contoured to 3.5 σ). The manganese and iron atoms are depicted as purple and orange spheres, respectively. Kβ1,3 XES of oxidized RNR in crystal and in solution collected at room temperature with an XFEL is shown to the left. A Mn(II)Cl2 calibration standard is also shown to illustrate the absolute oxidation state of the solution and crystal spectra. Fe Kα XES Data collected from oxidized RNR crystals is shown at the right.
