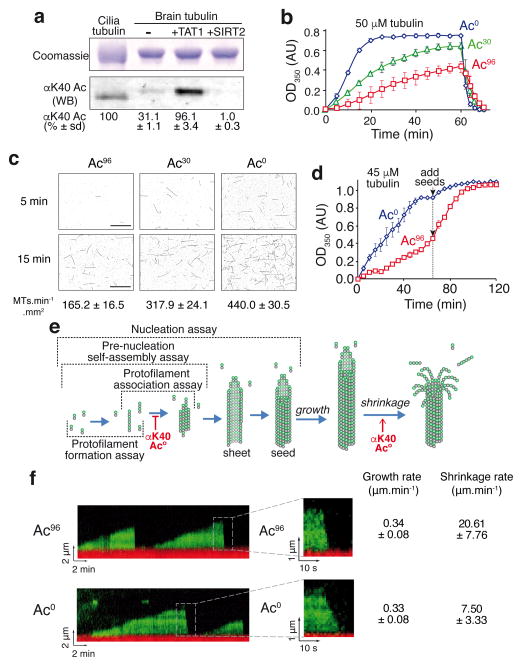
Figure 1. αK40 acetylation impairs microtubule nucleation and accelerates depolymerization.
a, Acetylated (Ac96) and deacetylated (Ac0) tubulin preparations were produced by treating purified brain tubulin (Ac30) with the acetyltransferase TAT1 or the tubulin deacetylatase SIRT2 as detailed in Supplementary Fig. 1a. Samples were resolved on SDS-PAGE and Coomassie-stained (top) or immunoblotted for αK40 acetylation (bottom). Axonemal preparations from Tetrahymena cilia provide a 100% acetylation calibrator. The measured levels of αK40 acetylation are shown below (mean of n=3 tubulin preparations ± SD). Unprocessed original scans of blots are shown in Supplementary Fig. 1c. b, Polymer formation was monitored by following the turbidity, or absorbance at 350 nm, of solutions containing 50 μM tubulin incubated at 37°C. Error bars represent the standard errors of the mean (SEM), n=3 independent experiments for Ac0, Ac30 and Ac96 tubulin. c, Fluorescence images of microtubules nucleated from 10 μM tubulin solutions incubated at 37°C and fixed at 5 and 15 min (images are representative of 3 independent experiments). The mean rate of microtubule nucleation (± SEM) from n=3 independent experiments is shown below each image. Scale bar: 10 μm. d, Polymer formation was monitored as in b, except that starting tubulin concentration was 45 μM and that 5 μM GMPCPP-stabilized microtubule seeds were added after 70 min. Error bars: SEM, n=3 independent experiments. e, Diagram outlining microtubule nucleation and dynamics. The various assays used in this study are outlined and the effects of tubulin acetylation discovered in this study are shown. f, Kymographs of dynamic Ac96 and Ac0 microtubules imaged by TIRF microscopy (representative of 3 independent experiments). In red are the GMPCPP stabilized microtubule seeds and in green the dynamic microtubules elongating from the seed. Insets show depolymerizing microtubules at higher magnification. The rates of growth and shrinkage are shown on the right, n = 117 Ac96 microtubules and n = 156 Ac0 microtubules (pooled from n= 3 independent experiments, data are mean ± SD). Source data for 1b and 1d can be found in Supplementary Table 1.

