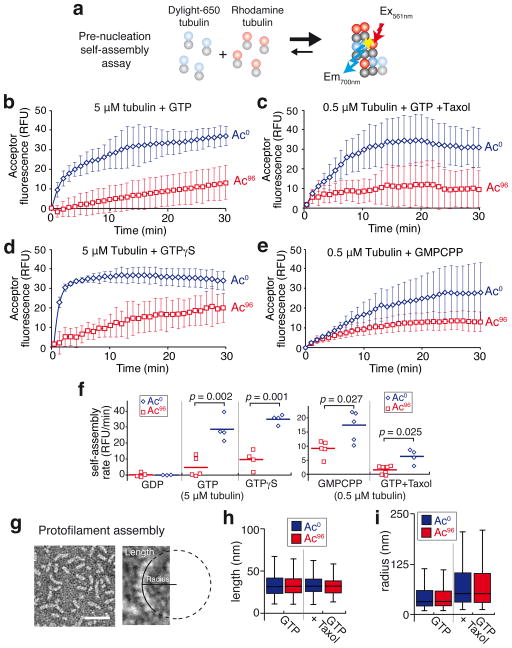
Figure 2. Tubulin acetylation affects tubulin self-assembly.
a, Diagram of the FRET-based pre-nucleation self-assembly assay. b–e, Tubulin self-assembly assayed by inter-dimer FRET. A solution of free tubulin below the critical concentration for nucleation in which 10% bears a DyLight 650 label and 10% a rhodamine-label was incubated at 37°C and self-assembly was followed in a spectrofluorimeter by exciting rhodamine at 561 nm and measuring DyLight 650 emission at 700 nm. Data points are mean ± SEM, b, 5 μM tubulin was mixed with 1 mM GTP. n=5 for Ac96 and n=4 for Ac0 tubulin. c, 0.5 μM tubulin was mixed with 1 mM GTP + 0.5 μM taxol. n=7 for Ac96 and n=4 for Ac0 tubulin. d, 5 μM tubulin was mixed with 1 mM GTPγS. n=4 for both Ac96 and Ac0 tubulin. e, 0.5 μM tubulin was mixed with 0.5 mM GMPCPP. n=5 for both Ac96 and Ac0 tubulin. n values represent the number of independent experiments. f, Dot plot of the pre-nucleation self-assembly rates for Ac96 and Ac0 tubulin. The experiment was done using 5 μM of free tubulin with 1 mM GDP, 1 mM GTP or 1 mM GTPγS, or 0.5 μM of free tubulin with 1 mM GTP + 0.5 μM taxol or 0.5 mM GMPCPP. The bar denotes the mean. The p-values were calculated using a two-tailed unpaired Student’s t-test. g, Taxol-stabilized protofilaments observed by negative stain electron microscopy. The length of each protofilament was measured and a circle was fitted onto the protofilament to measure the radius (images representative of 2 independent experiments). h,i, Box plots of the length (h) and radius (i) of the Ac0 (blue boxes) and Ac96 (red boxes) protofilaments assembled in the presence of GTP or GTP+taxol. For the GTP condition: n=612 Ac0 protofilaments and n=513 Ac96 protofilaments, for the GTP+taxol condition: n=542 Ac0 protofilaments and n=536 Ac96 protofilaments (pooled from 2 independent experiments). A Mann-Whitney test was used to compare Ac0 and Ac96 protofilaments populations in each condition. No significant differences were observed between Ac0 and Ac96 protofilaments in length (p=0.74 for GTP and p=0.07 for GTP+taxol) or radius (p=0.64 for GTP and p=0.94 for GTP+taxol). The box represents the 25th-75th percentile, whiskers indicate 1.5 times the range and the bar in the middle is the median.

