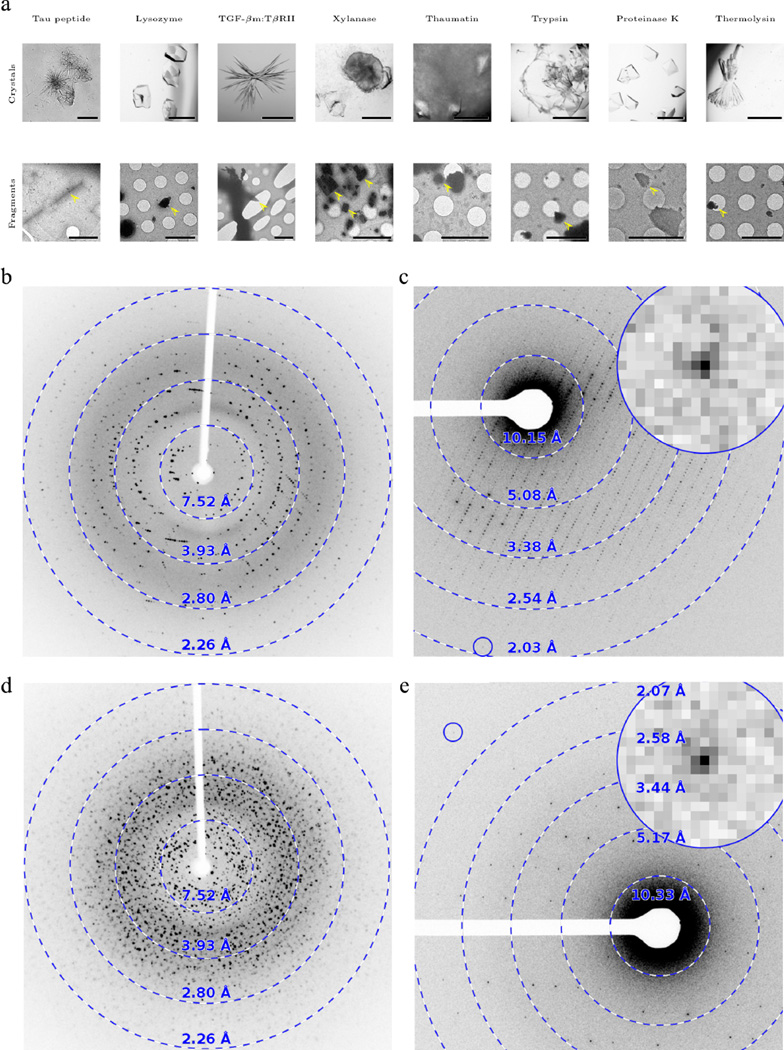
Figure 1. Crystals before and after fragmentation and their X-ray and MicroED diffraction patterns.
(a) Top row: light micrographs of imperfect crystals before fragmentation. Scale bars are 500 µm, except for tau peptide and TGF-βm:TβRII where the scale bar is 50 µm. Bottom row: electron micrographs of fragmented crystals (scale bars are 5 µm). The X-ray diffraction patterns exhibit multiple lattices (b; thaumatin) or even powder-like diffraction (d; trypsin). These pathologies are not present in crystallite fragments investigated by MicroED (c, e). The inset shows a close-up of the spot indicated by the blue circle. X-ray diffraction patterns were collected on a Cu-Kα home over a 0.37° rotation range; MicroED patterns were recorded as detailed in the methods section. Further examples are shown in Supplementary figures 1–9.

