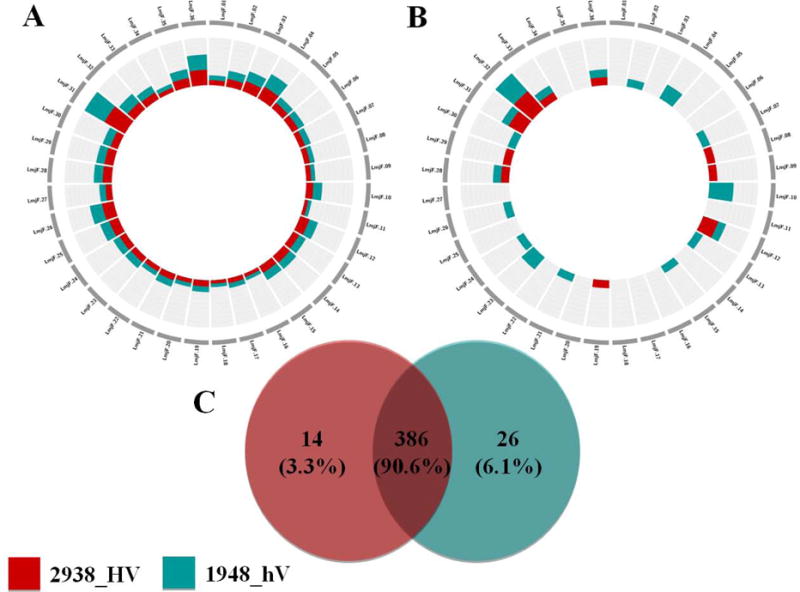
Figure 3. Number and chromosomal distribution of common or unique genes having both SNPs and InDels in 2938_HV and 1948_hV L. major isolates.

The plots show the number of variants associated to each chromosome. The chromosomes are not drawn to scale. The inner scale is adjusted to optimize the number of genes for each plot independently. (A) Chromosomal distribution of the total number of genes having both SNPs and Indels. (B) Chromosomal distribution of genes having both SNPs and Indels and that are unique to each isolate. (C) Venn diagram showing common and unique features after comparing genes having both SNPs and InDels in 2938_HV to genes having both SNPs and InDels in 1948_hV. 2938_HV isolate is indicated in red and 1948_hV isolate in green.
