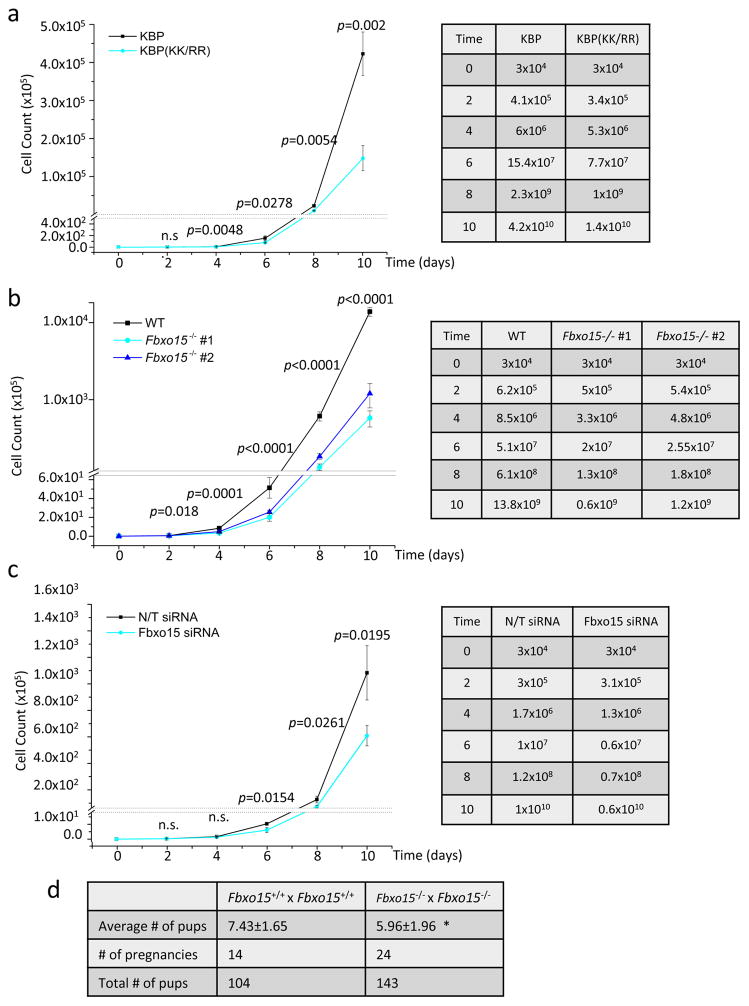
Fig. 7. In vivo and in vitro effects of KBP stabilization and loss of Fbxo15 on mESC growth.
a. mESCs were infected with lentiviruses expressing either HA-tagged wild type mouse KBP or HA-tagged mouse KBP(KK/RR) and plated at a density of 3×10⁴ cells/well. Every 48 hours, cells were trypsinized, counted, and re-plated at a 1:10 dilution. No changes in viability and cell death were detected in the two groups by Annexin-V/PI analysis [0.25% +/− 0.127 for wild type KBP and 0.29% +/− 0.255 for KBP(KK/RR); n=2 biologically independent experiments (see Supplementary Table 6)]. Right panel summarizes the average of each cell count. p value was calculated by unpaired t-test. Error bars indicate +/−SD. n=3 biologically independent experiments (see Supplementary Table 6).
b. Wild type mESCs (WT) and Fbxo15−/− mESCs (two different clones) were plated at a density of 3×10⁴ cells/well. Every 48 hours, cells were trypsinized, counted, and re-plated at a 1:10 dilution. Cell counts were performed using a Vi-CELL, an automated cell counter that simultaneously assesses cell viability. No changes in viability were detected in the three groups. Right panel summarizes the average of each cell count. p value was calculated by one-way ANOVA. Error bars indicate +/−SD. n=3 biologically independent experiments (see Supplementary Table 6).
c. mESCs were transfected with either a nontargeting (N/T) siRNA or an siRNA to Fbxo15 and plated at a density of 3×10⁴ cells/well. Every 48 hours, cells were trypsinized, counted, and re-plated at a 1:10 dilution with a further round of siRNA transfection. Cell counts were performed using a Vi-CELL, an automated cell counter that simultaneously assesses cell viability. No changes in viability were detected in the two groups. Right panel summarizes the average of each cell count. p value was calculated by unpaired t-test. Error bars indicate +/−SD. n=3 biologically independent experiments (see Supplementary Table 6).
d. Fbxo15+/+ and Fbxo15−/− mice were mated and the average offspring per litter was compared. n=14 and 24 pregnancies. *= p=0.0242, calculated with unpaired t-test (see Supplementary Table 6).

